Microsoft SharePoint Server and
SharePoint Online Monitoring
Proactive Monitoring for SharePoint Online and OneDrive

Monitoring SharePoint is Required
SharePoint is huge. While it has its moments of frustration, almost every business depends on it in one form – SharePoint Server, SharePoint Online, SharePoint 2013, SharePoint 2016, SharePoint 2019 – or another. The Microsoft 365 web-based collaborative application has use cases for businesses of all sizes. Most organizations depend on content and sharing to function. When this is the case, the application must be monitored because when it’s slow, not responding, or inaccessible, your end-users won’t be able to get their work done.
CloudReady SharePoint Monitoring Tools
CloudReady sensors provide complete coverage for monitoring Office 365. Monitor SharePoint end-to-end including critical interactions with Single Sign-On (SSO) like Microsoft Entra ID, Active Directory Federation Services (ADFS), and cloud-based SSO vendors including Okta, OneLogin, Ping Federate, and more.
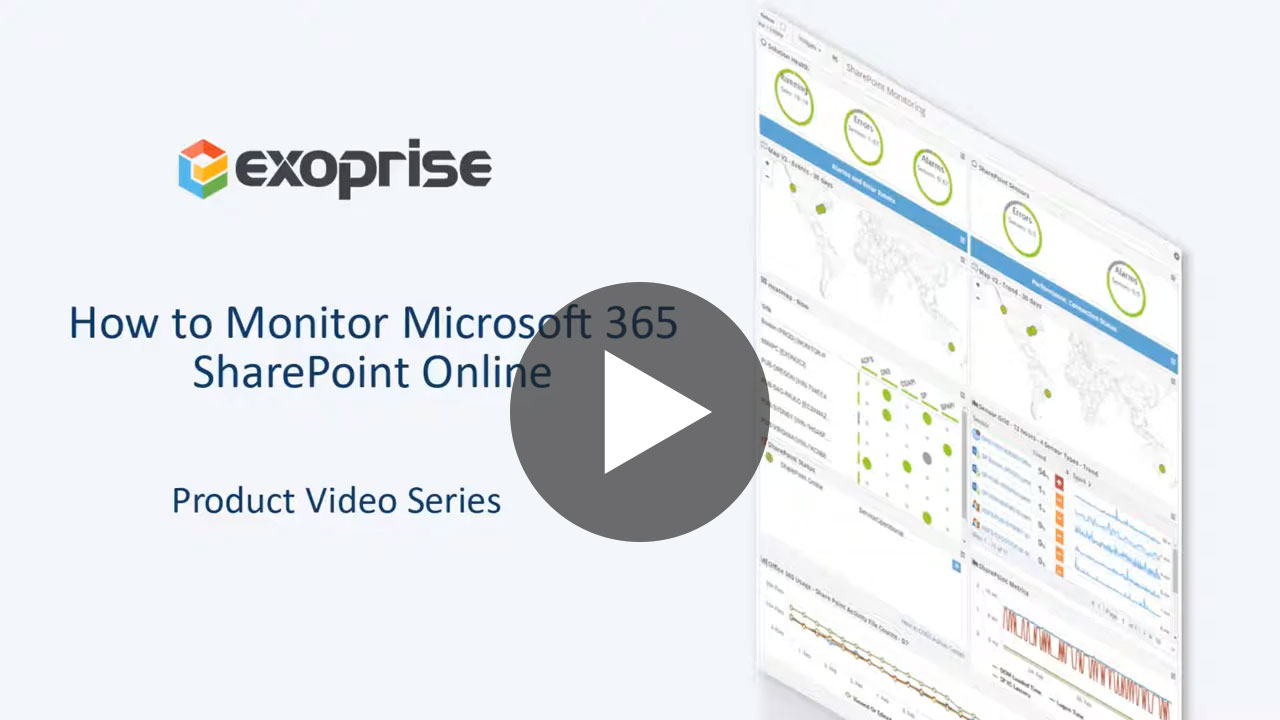
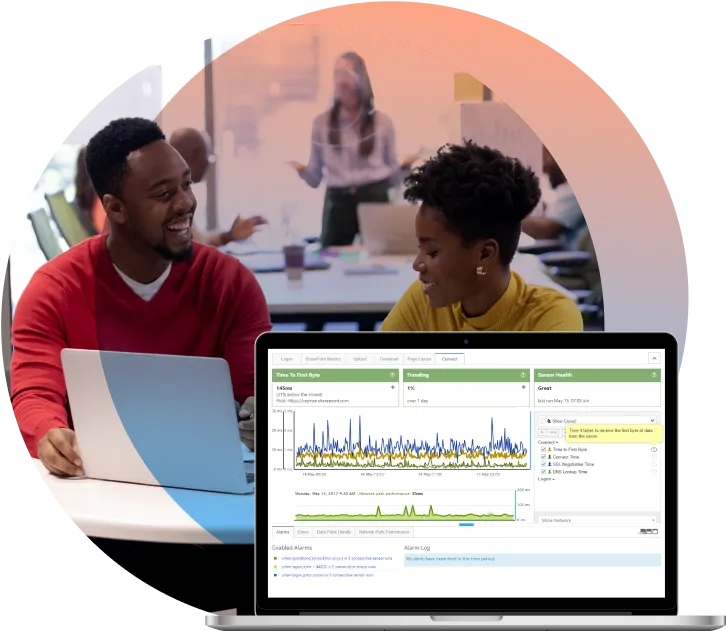
How to Monitor SharePoint Online Performance
Watch this video to see how easy it is to get started monitoring Office 365 SharePoint Online. Set up your first Exoprise synthetic sensor in minutes. Monitor SharePoint performance 24*7 and track when the server application is down or having issues.
SharePoint Online and OneDrive for Business Monitoring
SharePoint Logon Metrics
Federated or Managed, Proxy & Cross Application Timings
Measure and monitor SharePoint and OneDrive access control from every vantage point.
- Login Time – Total login time, page response, and SSO timings for managed or federated sign-ins
- Initial Page Time – Page load times, redirections, assets, and SharePoint resources
- Proxy Connect Time – Measure proxy overhead, latency, uptime and availability

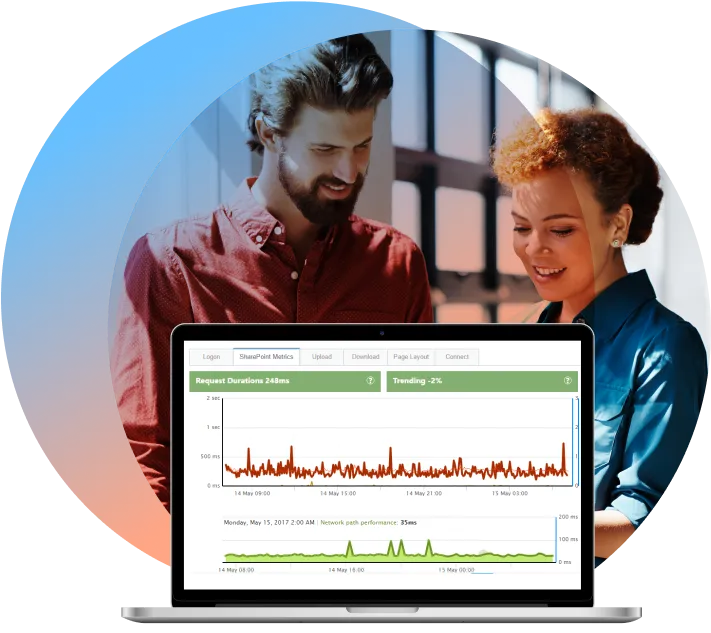
SharePoint Latency, Online Health Scores, and Request Timing
SharePoint Online and IIS health scores are captured, recorded and aggregated. Benchmark and compare app response times, outages, and errors against Exoprise crowd data.
- Request Duration – App page times and SharePoint request metrics as reported by the IIS web server
- IIS Latency – Average SharePoint latencies for the requests can indicate an under-performing SharePoint Online installation
- Health Scores – SP health score reveal the underlying health of a SharePoint site. Health scores are calculated using parameters such as memory usage, concurrent requests and processor utilization.
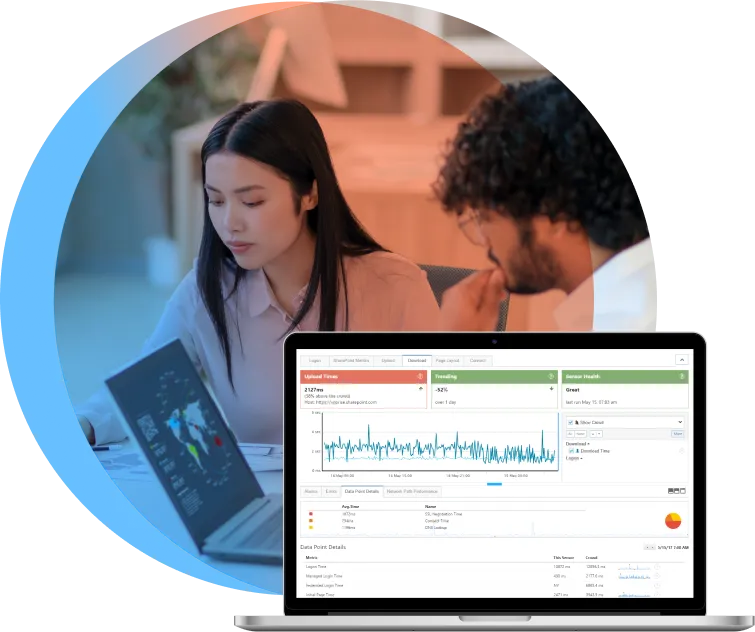
SharePoint Upload, Search, and Synthetic Download Metrics
CloudReady SharePoint and OneDrive synthetics emulate users uploading, downloading, and searching files for proactive transaction monitoring.
- Upload Time – This value is the duration, in milliseconds, of how long it takes to upload a 420k (average size of an office document) file to the server collection.
- Upload Search Time – Time spent finding the uploaded file in the library and measuring index and search performance
- Download Time – How long it takes to download the uploaded file from SharePoint, measuring latency, bandwidth and access times
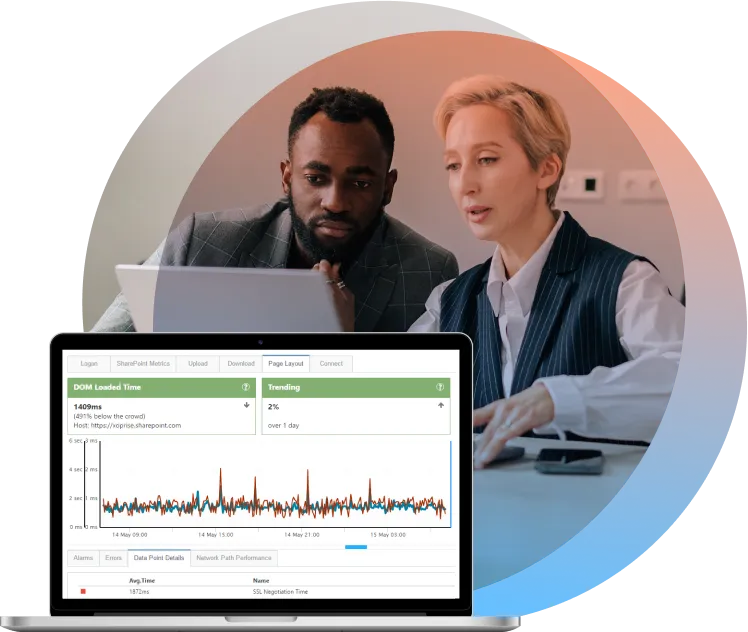
SharePoint Page Response and Loading Statistics
Page performance for SharePoint pages are captured to measure WebPart, DOM, page part, and JavaScript performance from an end-user’s perspective. Pinpoint slow servers and developer additions that slow down SharePoint delivery.
- DOM Loading Time – Page and DOM loading time is a core web vital and will slow business productivity
- Initial Page Layout Time – Typically, pages with dynamic content need more time for interaction which is captured.
SharePoint Monitoring and Network Visibility
Network timings such as TCP/IP Connect time, SSL Negotiate, and Time-to-First-Byte aide in troubleshooting poor network performance, proxy servers and connectivity problems.
- Connect Time – Time it takes to connect to the server for retrieving content and uploading files
- SSL Negotiate – Time it takes to handshake and perform the Secure Sockets Layer negotiation for the connection. This is the most network intensive of a connection to the SharePoint servers and will be affected by a slower (higher latency) network.
- Time to First Byte (TTFB) – TTFB is a critical measure of how overloaded IIS and SharePoint servers may be in processing and serving up content from Office 365.
- DNS Lookup – Host name resolution is measured for each part of the SharePoint page that is built up off content from different servers and CDNs.
Installation and Setup Is A Breeze
Using the Exoprise Management Client, customers configure and validate before deployment to a single or multiple sites. Our guided setup wizards guarantee an easy and successful deployment for end-to-end SharePoint monitoring.
- Deploy monitoring sites wherever you want to test from
- Configure the SharePoint sensor credentials, landing page, and libraries to access
- Be up and running with inside and outside monitoring in minutes

Subscribe to the Exoprise Newsletter
Subscribe to our weekly newsletter for the latest updates and cloud performance stats