Ensure the world’s leading CRM platform delivers on its potential to empower your team
Salesforce Performance Challenges
If the app is slow or a page is not loading, IT and Salesforce admins have difficulty diagnosing Salesforce slowness. It can sometimes take hours for support teams to pinpoint and identify the root cause of Salesforce problems.
Turbocharge Your CRM with Salesforce Monitoring
Troubleshooting Salesforce with Exoprise
Watch how you can troubleshoot end-user experience issues with Salesforce utilizing CloudReady Synthetics and Service Watch.
Upon returning from a weekend, our employees couldn’t access Salesforce in the morning. As a result, IT and other teams spent half a day trying to find the root cause, which cost the company at least half a million dollars. With Exoprise synthetics, we would have immediately narrowed the problem to a network, SASE change and saved a huge loss and downtime for the company.
Global CRM Head,
Financial Services Company
Synthetics and Real User Monitoring for Proactive Salesforce Outage Detection
Monitor Salesforce Performance and Availability From All Endpoints
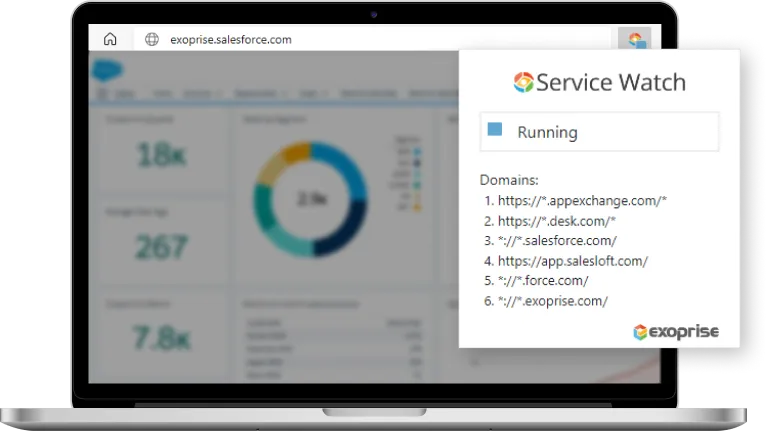
Configure specific Salesforce URLs and domains to monitor. Then deploy the browser plugin extension for remote users or office users to monitor Salesforce network paths in minutes. Service Watch Browser-based RUM securely collects performance data, allowing network teams to track and analyze Salesforce app performance anytime using the following metrics.
| Overall Web Experience Score | Page Response Times |
| Time-to-First-Byte (TTFB) | Proxy/SASE Access Times |
| DNS Lookup Time | SSL Negotiate Time |
| MFA Login Time | Core Web Vitals |
| Client, Network, Server Load Metrics | VPN Access Time |
| Federated, Managed Login Timing | Navigation & Resource timings |
Read more about Salesforce Real-User Monitoring.
Visualize Salesforce Experience for Employees
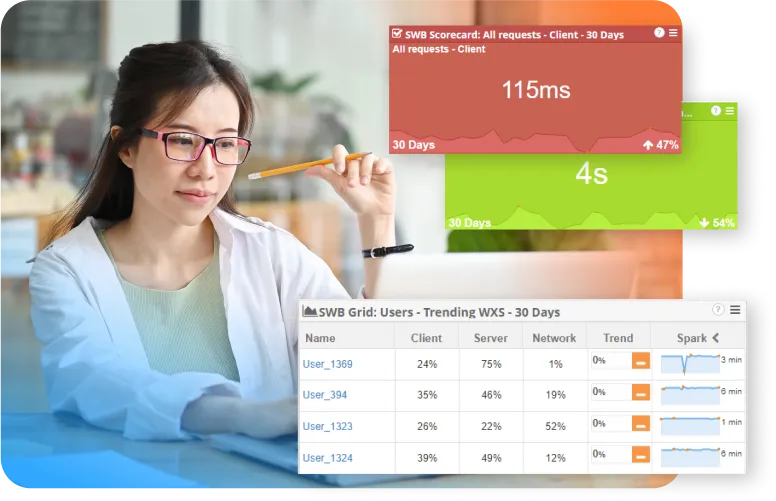
Quick overviews of the employee Salesforce digital experience enable the helpdesk and network administrators to stay informed of Salesforce outages and performance. Identify and prioritize problems with specific configured Salesforce domains — based on the web experience digital score. No more guesswork, quickly troubleshoot Salesforce access and Lightning performance problems.
Learn More About Service Watch Browser
Real user monitoring of SaaS and Web applications to proactively detect performance problems, errors, and outages.
Analyze Page Render Performance for Salesforce Apps
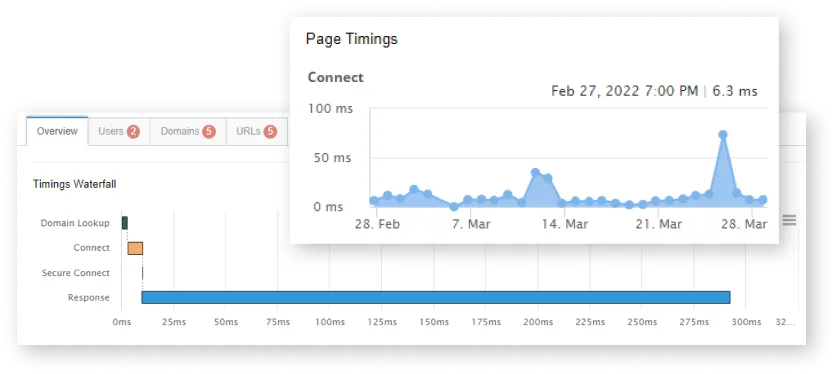
Salesforce Lightning renders more content at the client than the classic version. App Exchange and third-party Salesforce Apps leverage client and server-side navigable pages. Service Watch Browser captures configured page and resource timings for accurate telemetry into the overall experience.
- Input Delay
The time it takes for a page to allow user input. Also referred to as First Input Delay. For page and Salesforce app navigation, this measurement can influence employee productivity. - Page Jump
The percentage amount that the page shifts or “jumps” while it’s loading. This can lead to a user clicking on something unintentionally. For Core Web Vitals, it’s sometimes referred to as Layout Shift - Page Paint
Page Paint is the time it takes for the page to finish rendering its largest element. Also referred to as Largest Contentful Paint (LCP). LCP is about how fast the web pages are perceived to load.
Salesforce Network Visibility
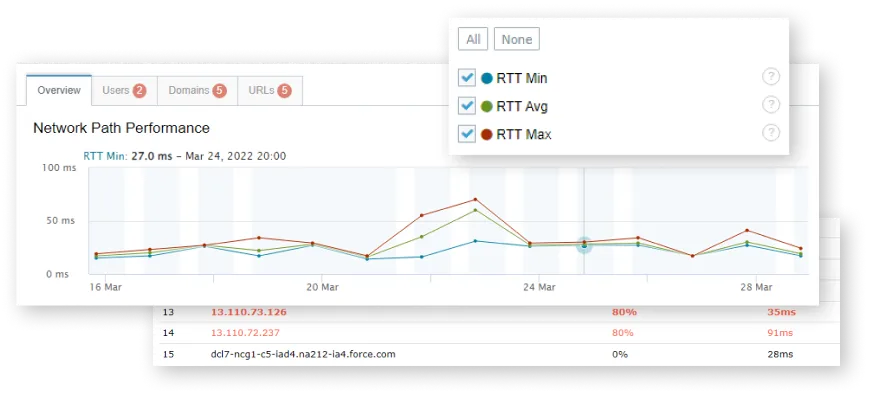
Service Watch monitors the connectivity from endpoint devices to the Salesforce service and tracks the underlying network path. Pinpoint the slowest nodes and Internet Service Providers (ISPs) for root cause and recovery. When employees complain about page problems, quickly identify slowdowns, packet loss, and latencies occurring in the network path. Leveraging network synthetics, real-user monitoring, and crowdsourced ISP metrics, network engineers are never in the dark when it comes to Internet outages.
Better Together – Combine Real User Monitoring with Synthetics
The Exoprise Digital Experience Monitoring platform takes Salesforce performance monitoring to the next level. Combine proactive Synthetic Transaction Monitoring (STM) and endpoint Real User Monitoring (RUM) in a single pane of glass to provide a rich end-user digital experience for Salesforce app users.
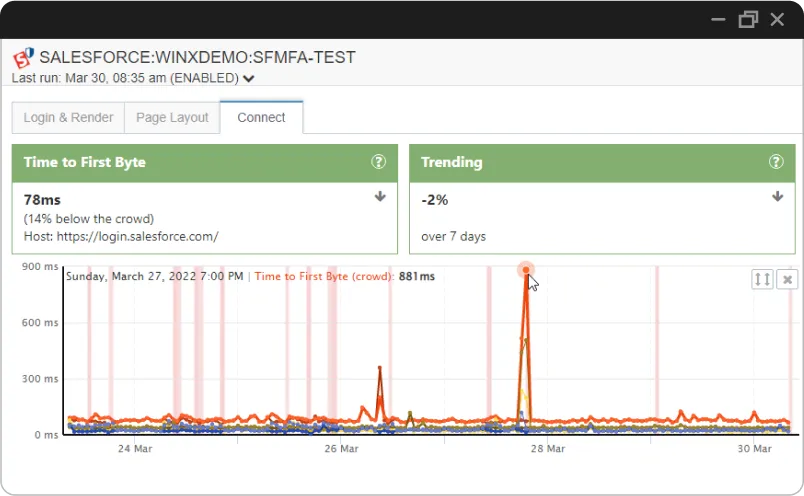
Benchmark Your Salesforce Network Connectivity
CloudReady synthetics for Salesforce apps provide instant benchmarks and proper baselines for Salesforce connectivity. Why? Salesforce server response time is vital to delivering a high-quality experience to end-users. CloudReady synthetic monitoring benchmarks and compares the performance of your hosted Salesforce server with a global customer base as an opportunity to optimize your network.
Read more about crowdsourcing analytics.
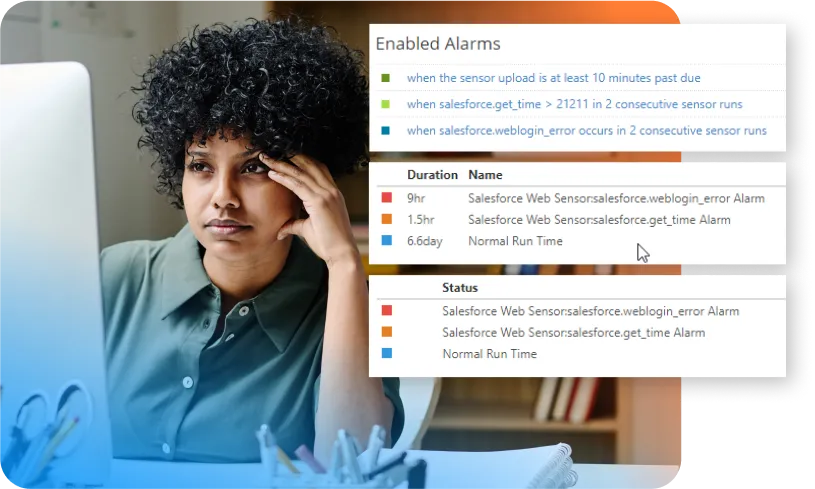
Is Salesforce Down? Proactive Alerts to Know About Outages Early
Alarms are automatically configured for proactive notification of Salesforce outages. Take the necessary steps, such as communicating with employees early, rolling back changes, and isolating root causes.
- Planning initial rollout or monitoring of the existing Salesforce platform deployment
- Monitoring Salesforce experience and performance from multiple locations
- Reporting Salesforce availability and uptime stats with trend analysis (30- or 90-day period)
- Gaining first-hand Salesforce performance and user experience knowledge after deploying a production fix
Subscribe to the Exoprise Newsletter
Subscribe to our weekly newsletter for the latest updates and cloud performance stats
Answers to Common Questions About Salesforce Monitoring
A 15-day trial includes up to 3 synthetic transaction sensors (CloudReady) from any location, Service Watch Desktop for up to 25 users, and Service Watch Browser for up to 50 users. Both tools can be used for complete Salesforce application monitoring and optimizing critical business processes.
CloudReady sensors don’t require scripting and can be configured to navigate the App Exchange or Salesforce reporting. Exoprise Salesforce monitoring tool supports testing accounts with MFA enabled to ensure the security and integrity of your environment.
Yes, Exoprise monitors all of the security solutions and their impact on SASE or security solutions.
Yes, Service Watch Desktop is a superset of Service Watch Browser and correlates client-side performance metrics alongside browser metrics (and a bunch of other things!).