 Service Watch Desktop
Service Watch Desktop monitors every critical aspect of the employee digital experience to ensure success and satisfaction with networked business apps.
Transforming Hybrid Work with Service Watch Desktop
Hybrid work is the new normal with reliance on Unified Communications-as-a-Service (UCaaS), secure access, and networking to ensure productivity with cloud and SaaS apps.
When employees experience network or device problems, business suffers. This is why you need Network Digital Experience Monitoring, we call it Network DEM.
Service Watch Desktop monitors every critical aspect of the employee digital experience to ensure success and satisfaction with networked business apps. Service Watch is a born-in-the-cloud DEM/DEX solution with quick ROI, unparalleled features, and infinite scaling.
Service Watch Desktop Solutions

High-Level Scores, Low-Level Capture
In-depth insight into network, system, and app utilization

Diagnose Hybrid Work Apps and Networking
Troubleshoot employee issues no matter where they roam

Network and App Intelligence You Can See
Rich visualizations for Wi-Fi, ISPs, SASE, WAN/LAN, VPN and more
Service Watch Desktop Deploys in a Snap
Simple Steps to Create an Endpoint Configuration
Service Watch Desktop Features for Endpoint Monitoring
Core features and data analytics to accelerate understanding for the entire IT teamImportant System Resources, Real-Time Insight for Every Endpoint
Service Watch Desktop captures 1000s of metrics every second for long-term trending, real-time alarms, and root cause analysis. Easily group, and refine device and application scoring by asset, CMDB values, Organizational Unit, user, and more with Device Groups.
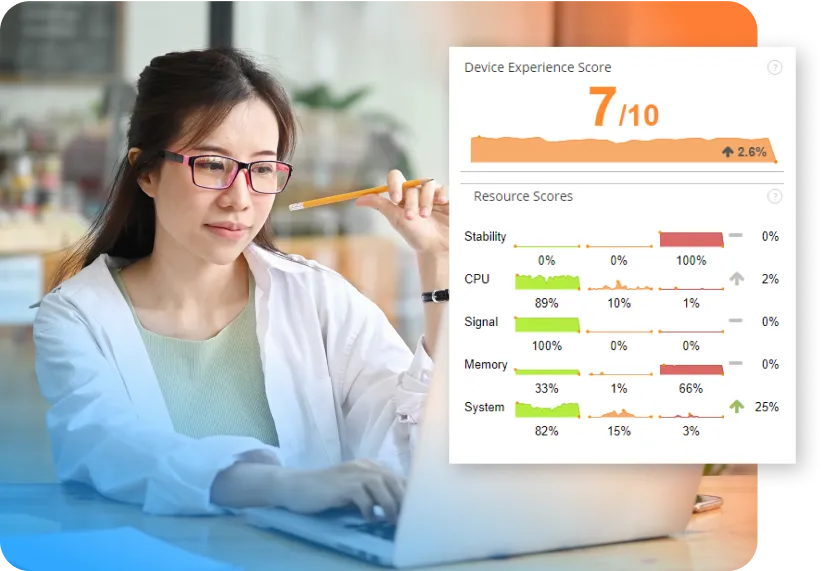
Resource Scores for Benchmarking, Discovery and Prioritization
Important system and experience metrics are rolled up, aggregated, and crowdsourced to help analysts make sense of the data and get to the root cause quickly.
- Quickly detect issues across thousands of devices and users
- Customize thresholds for Good, Fair, & Poor experiences
- Roll up data from Wi-Fi signal strength, to process queues and OS paging. See how low-level metrics impact end-user productivity.
- In-depth detail for long term trending and just in time diagnosis
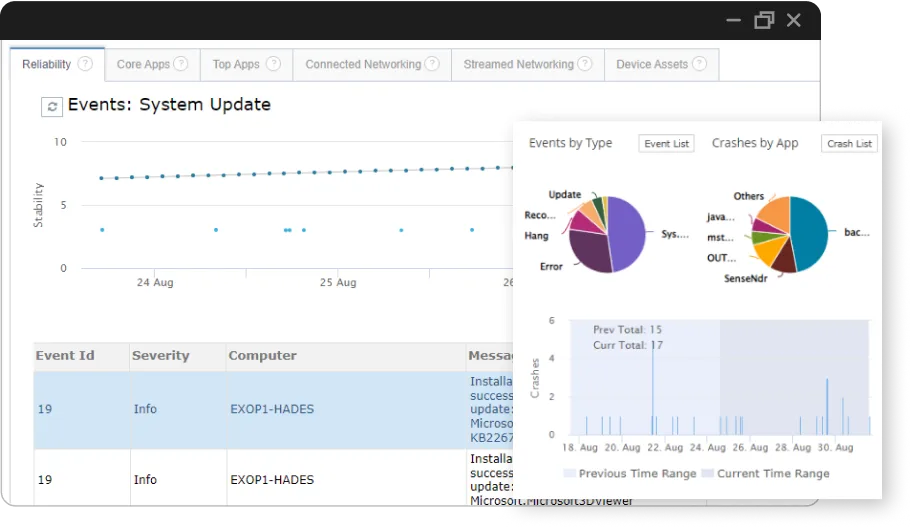
OS Machine Reliability & Stability, Experience Indexes
Service Watch Desktop records reliability data across endpoint devices for trending and prioritization.
- Know which applications cause grief and prioritize fixes
- Correlate system updates and problems across your environment
- Crowdsourced app and OS reliability scores
- Faults, Crashes, Hangs, Updates and Blue-screens collected for slicing and dicing
- Full support for Windows, macOS, and Linux endpoints
Network Visibility from App to ISP, the Internet and Provider
Network response time, latency, jitter, packet loss, and connectivity issues are common of complaints of employees and IT help desks.
Only Service Watch captures response time and packet loss metrics from thick client apps like Outlook, Teams, OneDrive, Zoom, WebEx, and Slack for network application monitoring. Improve the desktop experience (DX) for every employee.

Diagnose SaaS App Performance from Browsers and Client Apps
Browsers have become the most important (& complicated) app for knowledge workers in every enterprise. We reserve a special place for Web Experience Scores and how they weigh into the overall experience metrics for a user within the Exoprise platform.
- Read more about Service Watch Browser
- Read up on our Web Experience Score
Monitor Endpoint Application Impact, Every App
Service Watch Desktop doesn’t just record simple perfmon stats. Metrics are captured when the user is active, so critical signals rise to the top for evaluation.
- Records 1000s of app, service, and network metrics every second
- Detect leaks, runaway apps, hangs, faults, crashes and more across core and every day applications
- Captures to just before the user is active — and just after to identify the culprit
- Sifts, sorts, and filters the most important applications to track and highlight the real problems
Give it a try across 25 desktops for free
RUM + Robots: Lightweight Synthetics From Any User Device
Service Watch supports running lightweight synthetics from every user device. Detect problems before they impact the user and business. If you’re just passively capturing DEX metrics, then you’re waiting for a user to be impacted before you know about an issue.
- On-demand diagnosis of the user or network infrastructure issues
- Proactive VPN performance from user devices; at home or on the road
- Triangulating and troubleshooting ISP and Internet performance from at-home user machines

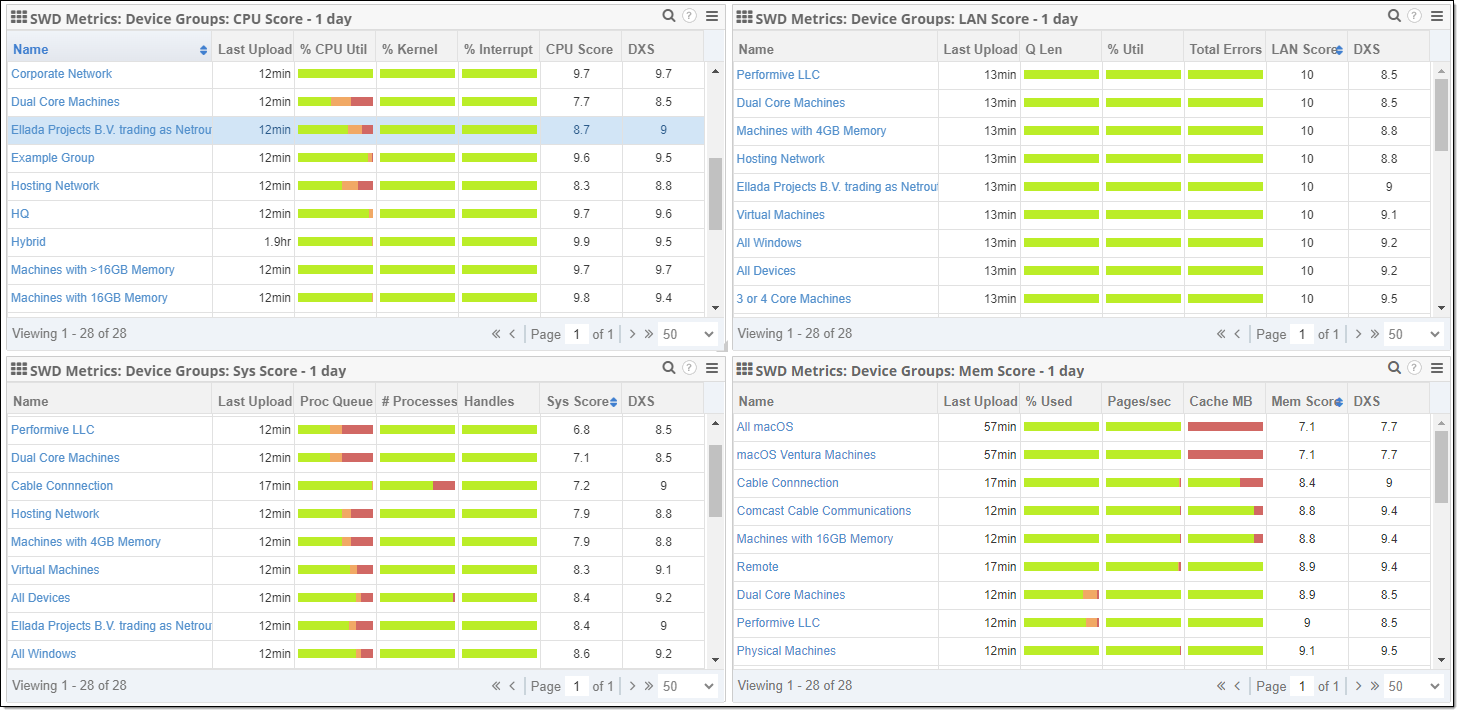
Group Stats Together Based on Any Attribute with Service Watch Device Groups
Device Groups enable infinite grouping of app, system, and network metrics for trending and diagnosis. Group by manufacture, app usage, ISP location (Comcast, Verizon) and more to reveal and solve any big data problem.
- Analyze data to diagnose system, app, and network issues
- Easy-to-use benchmarking to optimize refreshes and track change effects
- Compare groups of devices by cost center, branch, network, ISP, and more
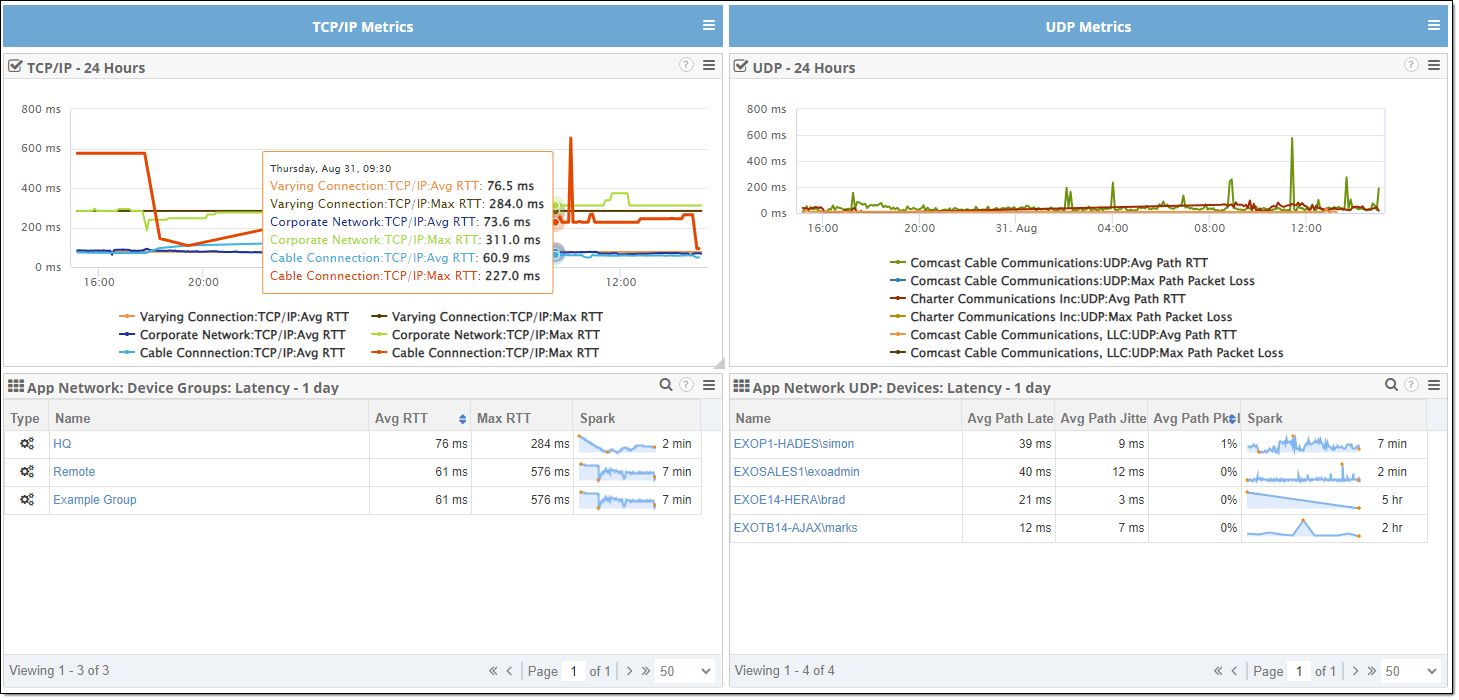
Visualize Latency, Jitter, Packet Loss With The App Network Dashboard
Application network dashboards detail TCP/IP and UDP latency for every network device to compare ISP’s, applications, and devices.
- Compare internal network performance
- Real-time insight into network and ISP performance affecting enterprise employees
- Visualize network performance for Teams, Zoom, WebEx and more
Correlate RUM Data With Synthetic Transaction Monitoring
Real User Monitoring is great for diagnosing specific user or network issues, but doesn’t notify you before a user is affected. RUM doesn’t help with outage prediction or help you in advance of a problem.
Deploy CloudReady synthetics along with Service Watch Desktop to capture the complete picture. Know in advance of a problem — know before a business unit is impacted.