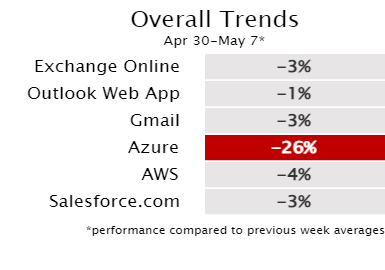
Cloud Performance Trends Measured by the Crowd
The Weekly Cloud Health Report is brought to you by Exoprise CloudReady®
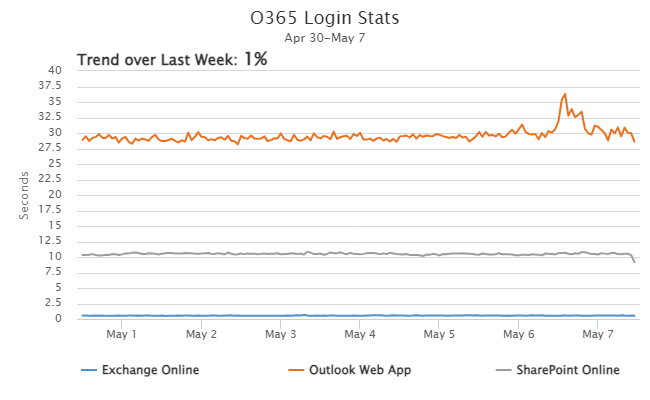
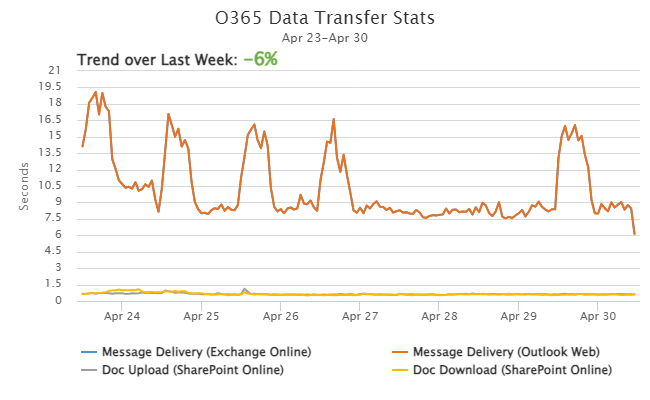
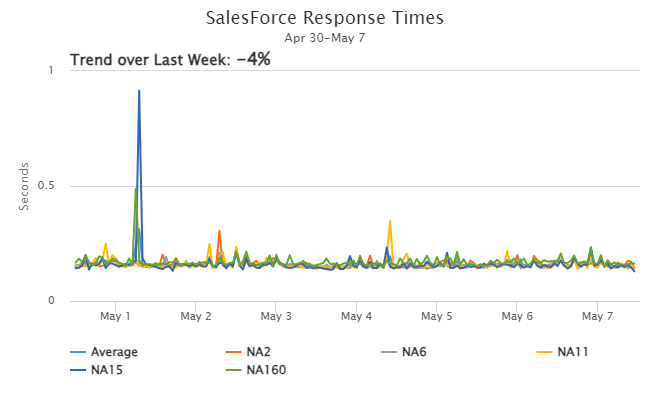
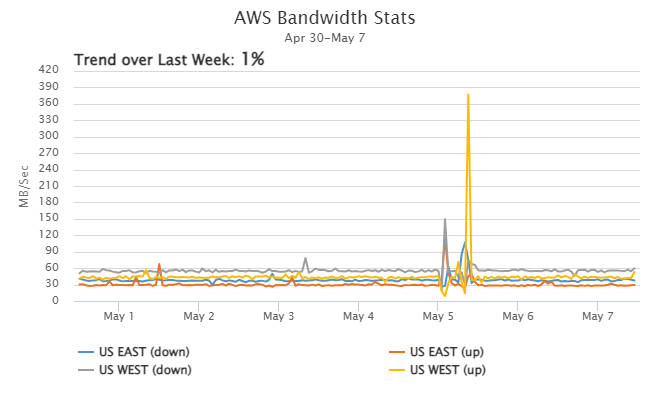
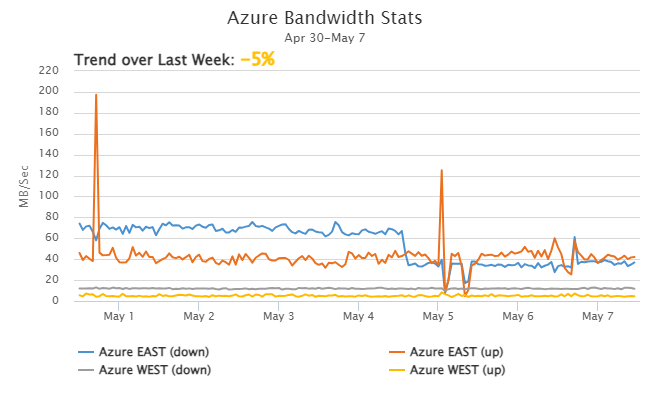
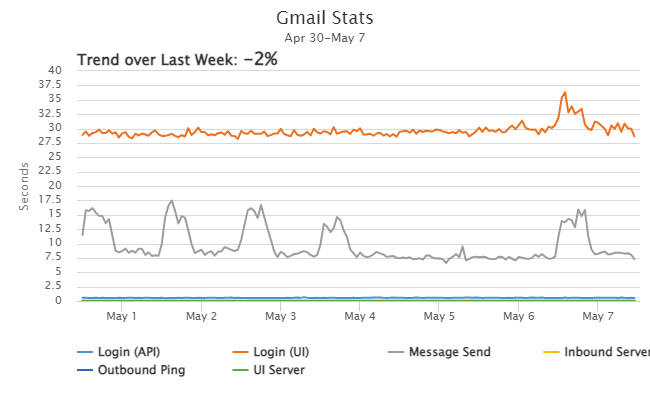
The graphs and tables below summarize real user performance data collected from the Exoprise Crowd – our global network of sensors deployed by our customers in their networks, from the locations where their users access the cloud.
| (Click on logos to visit provider dashboards.) | |
Office 365 | |
 | |
 | |
Salesforce.com | |
 | |
Amazon Web Services | |
 | |
Microsoft Azure | |
 | |
Google Apps | |
 | |
Join the Crowd!
Want this type of insight into your cloud-based apps and services? Get detailed cloud app performance and availability data measured from your user locations, compared with regional and global crowd aggregated averages, plus network diagnostics and real-time alerts to keep you on top of issues affecting your users.
