With every webpage loaded, email sent, or video streamed, network traffic takes a complex journey…
Introduction
Exploring the Internet via a web browser such as Google Chrome, Firefox, or Microsoft Edge is commonplace today. But at times, end-users visiting SaaS apps through multiple channels can face several performance issues.
- Slow Wi-Fi and network speed
- Increase page response times (TTFB)
- Long page load times
This leads to end-user dissatisfaction and frustration.
And why is this important? During these inevitable circumstances, expectations from IT increase to deliver a faster and flawless service. After all, employees remain efficient and productive at work. But any negative or poor experience significantly impacts business revenues and reputation.
Therefore, in order to fix these issues, your team needs a digital experience monitoring tool to collect application performance metrics and distill them into an easy-to-understand Web Experience Score (WXS).
Why You Need a Digital Experience Monitoring Strategy
5 Reasons to Measure Web Experience
Today’s web applications are complex. Moreover, bandwidth consumption and network congestion issues continue to plague the Internet, home networks, and Wi-Fi access points.
And often we see that network slowdowns impact the performance of business-critical enterprise apps such as Microsoft Teams, Salesforce, Zoom, etc. Hence, an objective measurement of employee web experience is becoming the new digital experience future.
Device Proliferation
As you are already aware, the global pandemic, corporate digital transformation, and #Workanywhere initiatives have led to mass device proliferation. On average, each worker today has 2-2.5 devices. Surely, this number is bound to increase in the years to come.
Nevertheless, 127 devices are connecting to the Internet every second. And by 2027, there will be 41 billion IoT devices. Managing this plethora of devices for hundreds to thousands of remote employees will be a monumental challenge for IT. Not only has technology consumption changed over the past decade but workers also expect streamlined management and smoother integration with their devices.
Single Page App (SPA) Popularity
The SPA architecture offers the most recent web technology trend since 2020. Web applications including Facebook, Gmail, Google Maps, etc., work in the browser, are faster, and don’t need any page to reload. Thus, making the end-user experience dynamic and responsive. Recently, data from Statista suggests that nearly half of the global website traffic is through mobile devices.
As a result, companies looking to optimize mobile and web shopping experiences for end-users are switching to SPA. You can expect to see higher engagement levels and business growth with this new shift.
Reduce Employee Attrition
Did you know? According to Forrester, “Remote work will settle at 3X pre-pandemic levels, offering an opportunity for firms to snap up top talent and keep them happier”. Therefore, in order to retain the best talent, your team will need to align technology experience practices with HR. And here is the truth. Diagnosing and troubleshooting modern IT issues using traditional tools can be lengthy and costly.
On the other hand, a seamless end-user experience with workplace technology makes workers productive. Enterprises gain a competitive advantage for attracting and retaining top talent.
Increase Conversions and Digital Engagement
Optimizing the overall experience for end-users drives higher engagement levels and boosts conversion rates for the business. While digital marketers focus on design aesthetics and perform A/B tests on different variations of a website, customers care about how a particular site performs at their end. For example, if a popular e-commerce application hosted on a server responds slow to browser requests, customers will ultimately abandon their shopping carts.
And when a weaker brand gets reflected in online reviews, it dissuades most new shoppers as they look up online reviews for validation. Do you agree that for businesses it’s more expensive to acquire a new customer than a returning one? Not only that, 88% of online consumers are unlikely to return to a website after suffering a poor experience.
Better Quality of Service
IT professionals need visibility and understanding of the performance of delivered SaaS services. Applications like Microsoft 365 run on the cloud and are out of IT’s control. For example, latency and slow page-loading issues between client devices (mobile, desktop, laptop) and remote web servers degrade performance for end-users.
Granular metric insights about employee home networks, client browsers, Wi-Fi strength, etc., help network admins to identify bottlenecks and accelerate troubleshooting. Normalizing and quantifying collected insights provides a complete experience picture.

Limitations with Application Performance Index
Application Performance Index (Apdex) measures the end-user satisfaction level based on their experience with the web response time. However, using a single key performance metric to evaluate and manage the actual end-user experience does not reveal the entire picture.
As an example, Apdex does not consider navigation times, conversion rates, clicks, engagement levels, AJAX background requests, etc., in its score calculation. Additionally, several knowledge workers working remotely from multiple locations have entirely different configuration setups on their machines. Therefore, a solitary index score generated with this approach is too simplistic and inaccurate to deal with real-world scenarios.

As shown above, the Apdex formula includes a sample size satisfied with a threshold benchmark (specific response time) plus half of tolerating samples. It’s pretty obvious that no frustrated end-users are part of this equation. Not only that, the final count is divided by the total sample size.
While the formula includes every participant under “Total Samples”, it ignores a user base with higher troubleshooting priority. Thus, the score is more skewed towards satisfied users and their positive perception of application responsiveness. Please note that the subscript “t” is the target time, and the assumption is that the tolerable time is 4X the target time.
Without a doubt, a generic Apdex falls short when trying to measure the Digital Experience of SaaS or corporate web applications.
How to Measure a Digital Experience Score
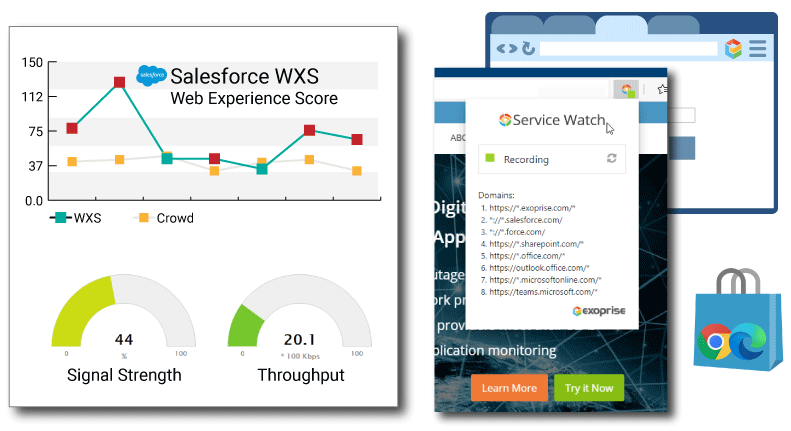
Businesses wanting to move beyond the numerous Apdex challenges should try the Exoprise Web Experience Score (WXS). WXS immediately depicts the overall health and performance picture of end-user experience with web apps irrespective of their device, network, location, or browser.
A higher WXS score (on a scale of 1-10) between 8-10 indicates a good and optimal end-user experience. In comparison, a lower score suggests a slow SaaS or web application that results in a poor digital experience and lower productivity.
Digital Experience Monitoring Tool Web Metrics – Part 1
Following user-centric metrics factor into the WXS calculation.
- AJAX/XHR Requests
Many SaaS applications have converted to what is known as Single Page Apps to simulate a rich, thick client application. The Service Watch Web Experience Score (WXS) takes into account background Ajax and XHR requests and monitors their TTFB’s and latency. - Largest Contentful Paint (LCP)
LCP is an important, user-centric metric for measuring page load speed. This newer metric is better than the traditional DOM Loaded metric which didn’t necessarily correspond to what the user saw on the screen. - First Input Delay (FID)
FID is one of the newer Core Web Vital metrics and measures page or application interactivity. To ensure a good user experience for a navigation, page transition, or application load, the FID should be 100 milliseconds or less. - Cumulative Layout Shift (CLS)
CLS measures the visual stability of the web page or application. Often, when a SPA or web page is loading there is background content that is being retrieved and added to the Document Object Model (DOM) which causes unexpected movement of the page. The goal is to keep unexpected movement to a minimum and have the page load smoothly. - *DOM Mutation
DOM mutation measurement is still an experimental metric within our Exoprise products. Along with CLS, DOM mutation observations attempt to calculate how often and the performance of changes to the web page or application. DOM updates are important for SPA apps like Salesforce Lightning, SharePoint, OneDrive and are often affected by the client or Desktop performance.
Digital Experience Monitoring Tool Web Metrics – Part 2
Additional WXS calculation metrics include
- Server, Client, and Network Request Timings
Client, Server, and Network Percentages and timings are more traditional metrics for determining where the slowdown is with SaaS applications and web pages. The Service Watch WXS take into account Client%, Server%, and Network% as part of every long-running request/response to compute the WXS. - Page Errors
No measure of web experience can be complete without some interpretation and aggregation of page errors per application and domain. This can be critical when corporate proxies are in place and often misconfigured due to changes in Content Data Networks that may not be allowed through a proxy due to neglect or timing. - Proxy Timings
Exoprise Service Watch Browser combined with Service Watch Desktop can detect slowdowns in transparent or cloud-based proxies. Along with other things in the network path like VPNs or SD-WAN routing, Service Watch provides the ultimate platform for detecting slow web experiences. - Network Path Performance
Finally, when integrated with Service Watch Desktop or Exoprise Synthetics, a detailed view of the network bottlenecks with hop-by-hop latency measurements can be captured and incorporated into the WXS. This can be beneficial for determining slowing ISPs, SDWAN nodes, egress gateways, and more.
As you can tell, we take end-user experience management seriously!
Exoprise offers WXS within its Real User Monitoring platform, Service Watch Browser to troubleshoot and optimize SaaS/web application monitoring for end-users WFH or office. The WXS scoring algorithm is holistic as it uses an industry-recommended threshold for good, fair, and poor application experience.
Optimize Digital Experience for Teams, SharePoint, OneDrive, and Microsoft Office 365
Here’s what we know.
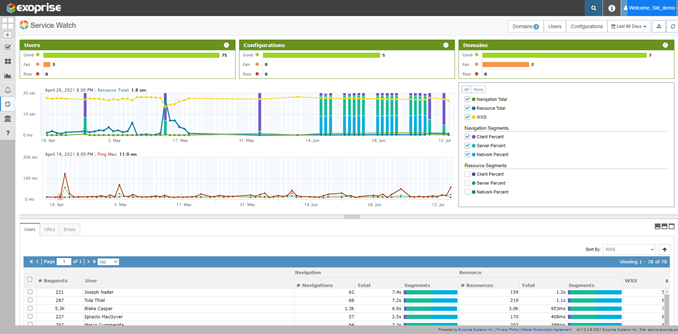
IT analysts are always interested to understand the end-user experience of platforms like Microsoft 365, Salesforce, GSuite, etc. Within the Exoprise Service Watch tool, we offer a “Service Watch Details” page. Admins can filter remote worker experience by a particular domain, region, or user.
Office 365 apps routinely suffer from outages or slowdowns due to last-minute configuration changes. Even worse, the incident status updates from the Microsoft support team take a while to reach the ears of social media.
As a result, IT cannot figure out if it is an issue on their end or with the service provider network. Meanwhile, remote employees submit tickets in frustration to add to ongoing chaos.
Quickly isolating the root cause and optimizing Microsoft 365 application experience for a diverse workforce is a must.

Browser Real User Experience Monitoring Analysis
Let us look at the below chart, for example.
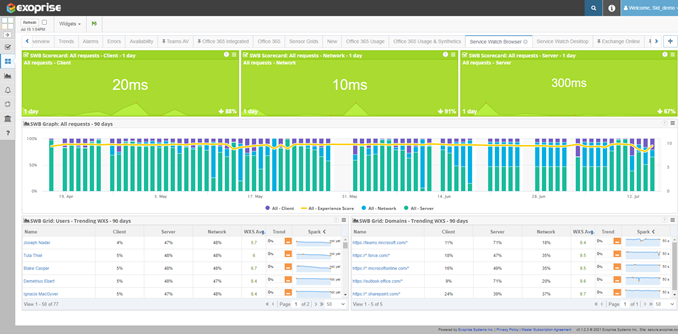
Over a selected 90-day period (customizable), Service Watch tracks performance degradation across areas such as users, configuration sets, and sub-domains. Our digital experience monitoring tool provides a high-level experience view (Good, Fair, or Poor) for quick analysis.
So far, 96% of employees are experiencing a good rating with Microsoft Teams, with the rest are encountering a fair experience.
If you carefully look below, the Service Watch provides an average experience score of 9.5 for the entire employee base. What is even more fascinating is that the tool immediately shows whether any decline in the Teams performance is at the client, network, or server segment. Network admins can use these real user monitoring insights to start the diagnosis and troubleshoot user problems.
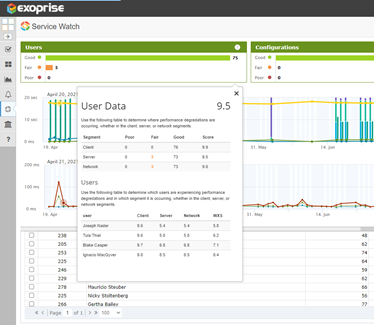
Drilling down on the same page reveals WXS trends and average scores in a chart. Any visible dip in WXS is an opportunity for IT to optimize the web experience for end-users.
Typically, the bottlenecks that cause slowdown include
- Large resource download
- Navigation timings
- Server timeouts
- Number of requests
- Segment time intervals
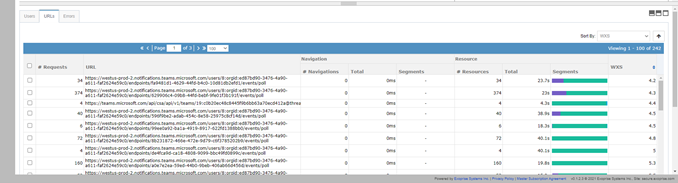
Furthermore, the URLs and errors section at the bottom provide relevant information to augment troubleshooting.
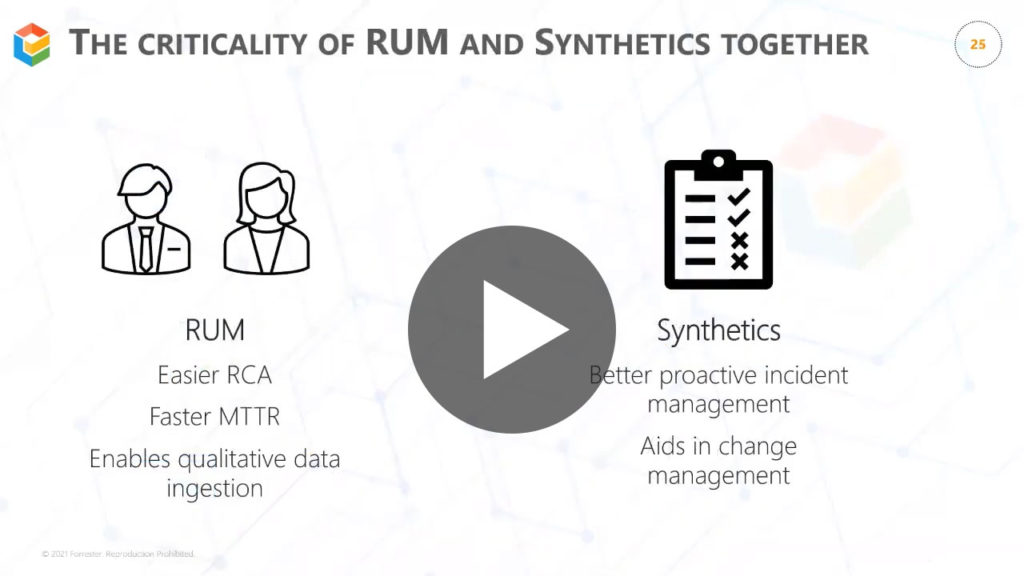
Better Together – Real User Monitoring and Synthetics
Along with WXS, the Desktop Experience Score (DXS) encompasses the entire Digital Experience Monitoring solution. As millions of users adopt the Work from Anywhere strategy, real-user monitoring and synthetic transaction testing will gain prominence in the IT community.
In the future releases of Service Watch, you can expect to see new adjustments and refinement to the WXS calculation. Exoprise commits to delivering innovative Microsoft 365 monitoring services to reduce MTTR and enhance the overall digital web experience for end-users.
Check out the webinar video we did with Forrester to learn more about our better together solution.
Try our Digital Experience Monitoring Tool for SaaS and Microsoft 365 Apps
Deploy up to – 25 Service Watch Desktop (DXS) and 50 Service Watch Browser (WXS) licenses – to monitor ALL of Microsoft 365.
Customers can also integrate synthetics with Service Watch for managing daily network operation activity.
Only the Exoprise digital experience monitoring tool gives you deeper and end-to-end visibility for Office 365 and SaaS applications (web and desktop).
Get started today without any credit card details or sales contact needed!
Related Posts


