With every webpage loaded, email sent, or video streamed, network traffic takes a complex journey…
As technology advances, operating systems play a vital role in providing a seamless user experience. Microsoft’s Windows OS has been at the forefront, constantly introducing innovative features over time. Two features related to improving the end-user digital experience are the Windows Experience Index (WEI) and Reliability Monitor. These measurements have become instrumental to Digital Experience Monitoring (DEM) in assessing system capabilities and measuring stability.
In this article, we will review the development of WEI and the Windows Reliability Monitor. Also, we will explore the factors involved in current stability scoring in relation to Exoprise’s monitoring.
Windows Experience Index – The Beginning
The Windows Experience Index, formerly known as Windows System Performance Rating (WinSPR), emerged with the release of Windows Vista in 2006. While Vista was still known as “Longhorn”, improvements affecting PC gaming were announced that hinted at the Windows Experience Index used with the WinSAT GUI.
Although Vista was delayed until late 2006, WinSAT (and the underlying Windows Experience Index) had been integrated into the Operating System (OS) since 2004.
Specifically, the development of the WinSAT feature, coupled with the WEI in Vista aimed to offer hardware evaluations right out of the box, effectively assessing the capabilities of the system. These features, available through the Windows Control Panel, became crucial once the OS was handed over to manufacturers.
WEI aimed to provide a single numerical score ranging from 1 to 5 in Windows Vista and to evaluate the overall performance of a system’s hardware configuration and, ultimately, response times. Its primary purpose was to allow users to determine if their systems met the requirements of resource-intensive applications. It also provided Microsoft with valuable data regarding hardware and operating system performance.
Running the WinSAT Command Line From Windows 10:
Even today, you can run a WinSAT assessment, and it provides insight into the performance of your machine. Open a command line and run “winsat formal”. Here’s sample output (from one of our virtual machines). It’s a clever assessment of performance metrics and possible performance issues.
> CPU LZW Compression                          298.00 MB/s
> CPU AES256 Encryption                        3206.96 MB/s
> CPU Vista Compression                        795.96 MB/s
> CPU SHA1 Hash                                2241.04 MB/s
> Uniproc CPU LZW Compression                  80.74 MB/s
> Uniproc CPU AES256 Encryption                827.26 MB/s
> Uniproc CPU Vista Compression                212.98 MB/s
> Uniproc CPU SHA1 Hash                        608.18 MB/s
> Memory Performance                           35192.06 MB/s
> Direct3D Batch Performance                   42.00 F/s
> Direct3D Alpha Blend Performance             42.00 F/s
> Direct3D ALU Performance                     42.00 F/s
> Direct3D Texture Load Performance            42.00 F/s
> Direct3D Batch Performance                   42.00 F/s
> Direct3D Alpha Blend Performance             42.00 F/s
> Direct3D ALU Performance                     42.00 F/s
> Direct3D Texture Load Performance            42.00 F/s
> Direct3D Geometry Performance                42.00 F/s
> Direct3D Geometry Performance                42.00 F/s
> Direct3D Constant Buffer Performance         42.00 F/s
> Video Memory Throughput                      20984.50 MB/s
> Dshow Video Encode Time                      0.00000 s
> Dshow Video Decode Time                      0.00000 s
> Media Foundation Decode Time                 0.00000 s
> Disk  Sequential 64.0 Read                   998.40 MB/s          8.4
> Disk  Random 16.0 Read                       122.04 MB/s          7.3
> Total Run Time 00:01:35.75
For the same machine that utilizes the assessment, we get these overall scores, which would be very helpful to have as baselines within digital experience monitoring tools.
PS C:\> Get-CimInstance Win32_WinSat
CPUScore : 8.9
D3DScore : 9.9
DiskScore : 7.85
GraphicsScore : 8.1
MemoryScore : 8.9
TimeTaken : MostRecentAssessment
WinSATAssessmentState : 1
WinSPRLevel : 7.85
Windows Experience Index Components
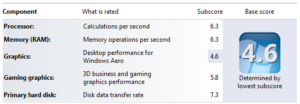
WEI was introduced as a user-friendly tool, simplifying hardware comparisons, and informing purchasing decisions. It evaluated five key components of a system, assigning each a sub-score:
1. Processor: The processor’s clock speed, cache size, and number of cores were considered.
2. Memory (RAM): This factor evaluated the total installed system memory and its speed.
3. Graphics: Both the desktop graphics rendering capability and the 3D gaming performance were assessed.
4. Gaming Graphics: This sub-score focused solely on 3D gaming performance.
5. Primary Hard Disk: The data transfer rate of the primary storage device was considered.
Windows 7 brought significant updates to WEI, including the integration of DirectX 10 support and reevaluated scoring thresholds. However, with the release of Windows 8, Microsoft decided to phase out the WinSAT GUI version of WEI. Interestingly, some sources reported Microsoft’s decision being influenced by consumer perceptions that Windows didn’t support a wide enough range of hardware because of the presence of WEI. And this is why we can’t have nice things.
Tracking System Stability with the Windows Reliability Monitor
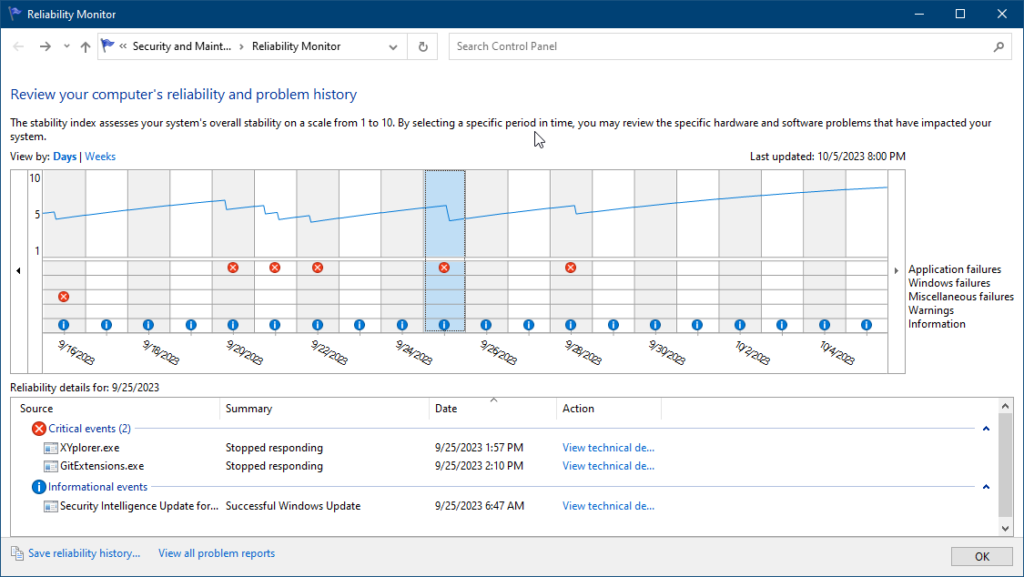
While Windows Experience Index focused on hardware evaluation, Reliability Monitor came into play with Windows Vista as a tool for assessing system stability. It provided users with a visual representation of system events, highlighting aspects such as application failures, Windows updates, and hardware or driver crashes. The addition of a stability index and reliability monitor provided a more accessible measure of overall system health set than the bloated event logs which started under Windows XP.
Reliability Monitor aimed to empower users by helping them identify software or hardware drivers causing system instability. By displaying a stability graph with a rating ranging from 1 to 10, it facilitated monitoring systems over time and allowed users to pinpoint issues occurring on specific dates or following significant changes.
Factors Considered for Stability Scoring
The resourcefulness of Reliability Monitor lies in its ability to calculate the system stability index based on several factors. While Microsoft has not explicitly shared the precise formula, multiple elements contribute to the scoring. Let’s explore the considered factors:
1. Application Failures
The occurrence of application crashes or hangs is a crucial factor. Frequent application instability can lead to a lower stability score and ultimately affects customer satisfaction.
2. Windows Failures
The Reliability Monitor considers Windows errors, such as Blue Screen of Death (BSOD) occurrences or system freezes. Recurrent issues of this nature significantly impact stability scores.
3. Miscellaneous Failures
This factor encompasses failures caused by hardware errors or problematic third-party drivers. The number of times these failures occur contributes to the stability index.
4. Windows or Driver Updates
Updates and application reconfiguration are noted as part of the system reliability index. Sometimes, system and app updates can cause more instability. The frequency and impact of such updates are considered when calculating stability scores.
5. Other Factors
Reliability Monitor also considers factors such as the system’s application and data responsiveness, user-initiated shutdowns, and system downtime. These indicators help evaluate overall system reliability.
Information Sources & Exoprise Monitoring
The Windows Experience Index exercises periodic system assessments and benchmarks to provide a score of the Operating Systems’s state in relation to hardware, software, graphics, third-party software. Understanding the components behind WEI and Reliability Monitor allows users to optimize their systems and ensure a stable and efficient computing environment. In the case of IT managed devices, this can lead to better business outcomes and productivity.
While the WinSAT GUI is no longer available, WEI is still available through the command line and via PowerShell which delivers valuable troubleshooting data.
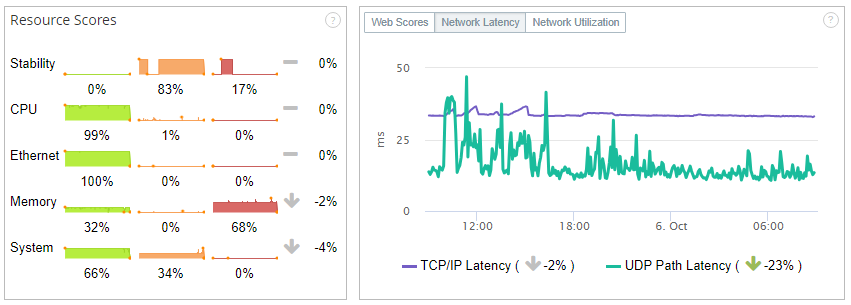
The underlying events monitored by Stability Index, known as ReliabilityRecords or ReliabilityStabilityMetrics in lower-level code, aid decision-making related to PC refresh, break-fix, and rollbacks. By collecting and aggregating these events, Exoprise monitoring products enable users to analyze patterns based on factors such as cost center, laptop manufacturer, and work location.
Exoprise Service Watch Desktop includes these reliability scores as part of its own Desktop Experience Score (DXS) alongside network and resource metrics.
The Experience Index to UX Monitoring
User Experience monitoring emerged from the humble beginnings of the Windows Experience Index and Reliability Monitor. Both tools played roles in the history of Windows OS since Windows Vista. While WEI simplified benchmarking and aided hardware purchase decisions, the Reliability Monitor helped users monitor system stability through visualized events. Understanding the components for stability scoring and the experience index are helpful in deducing end-user experience management.
As Windows continues to evolve, Microsoft focuses on refining and introducing new tools to assess performance and reliability. The historical development and purpose of WEI and Reliability Monitor demonstrate the significant efforts invested in optimizing user experience and addressing system stability. Exoprise leverages these foundations of event monitoring by collecting and correlating the information across policy and Intune management groups.
Related Posts


