With every webpage loaded, email sent, or video streamed, network traffic takes a complex journey…
The Microsoft infrastructure makes collecting network traces more complicated. Network traces (tracert) inside and out of the Azure Virtual Desktop virtual machine are valuable when diagnosing support issues or when an end-user calls up complaining of poor Azure Virtual Desktop performance. The following information should help improve the collection of network traces and trace data, which will aid in diagnosing Virtual Desktop Infrastructure connectivity.
This article will also document alternative methods of using lightweight network synthetics such as Exoprise CloudReady VoIP and Bandwidth sensors to proactively detect network performance problems.
The instructions in this document also apply to improving the network path performance that is collected as part of connected and streaming data by Service Watch Desktop. Applying these settings will improve your digital experience in telemetry, visibility, and network insight.
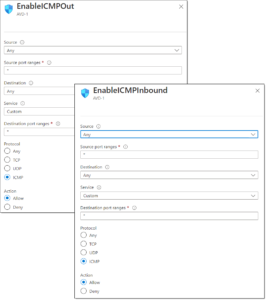
Enabling ICMP
The first step to start collecting this data is to enable ICMP for the network interface of the VM. Typically, on Azure, this setting is disabled by default. The important thing to make note of here is that both inbound and outbound ICMP must be enabled. When only one of these rules was enabled, the traces we were running were entirely unsuccessful, resulting in no route whatsoever.
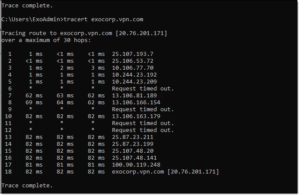
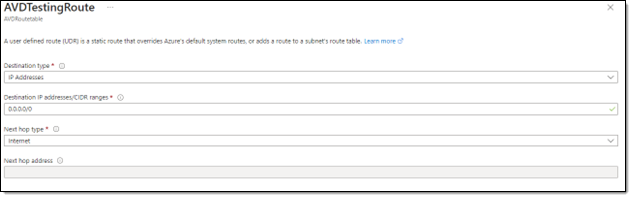
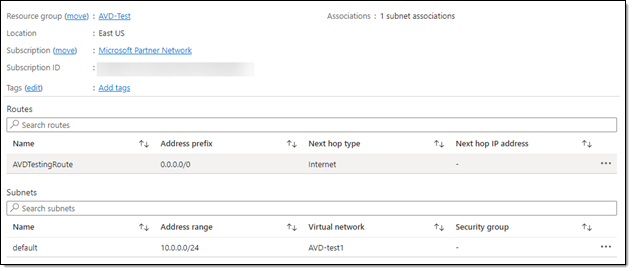
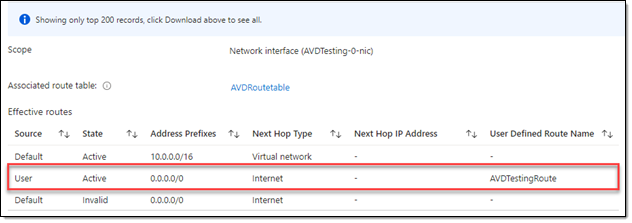
Effective Routes
The default routing tables for most remote desktop services, including Azure Virtual Desktop VM’s, are configured without a direct route to the Internet. This prevents any network path traces (traceroutes) from reaching their destinations. You can get a more detailed network trace by adding a User-Defined Route (UDR) to override the defaults.
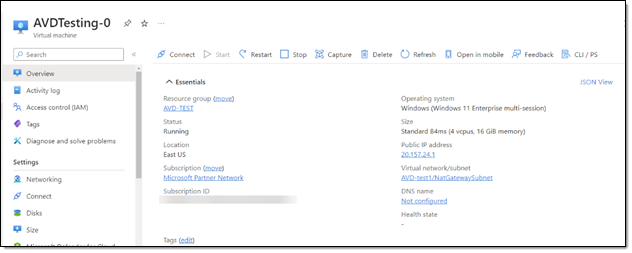
Public IP
When configuring your virtual networks, assigning a public IP to the virtual machines may be necessary. We were able to get a much better collection of network telemetry and more ASN and IP address information into the hop-by-hop network traces when we enabled public IPs. This applied to both Service Watch Desktop and the CloudReady Synthetics running from Desktop-As-A-Service (DaaS) environments.
If you want to save time and money diagnosing slow network performance, then you have to have the data.
Something to keep in mind is the limitations in the Azure Virtual Desktop infrastructures. Collecting ICMP data from the cloud pc’s may be limited. Even when logged in to one of these hosted machines. Attempting to run a traceroute or ping command will have limited results regarding the internal Azure networking. Microsoft doesn’t want you mapping out their internal network.
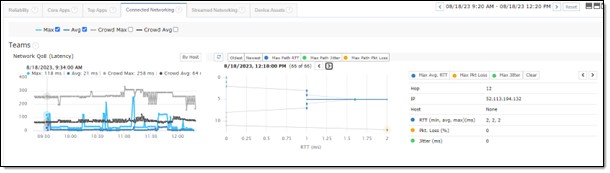
Proactive Application Monitoring
The proactive monitoring of Core applications from Service Watch Desktop will be actively raise alarms when issues are detected. These alarms can trigger off metrics such as high latencies, round trip times, or packet loss. For more advanced testing and proactive 24/7 monitoring, we recommend deploying CloudReady synthetic sensors to the virtual desktop infrastructure. Synthetic sensors will help make sure that VPNs, proxies, web servers and overall networking are healthy for users. This is crucial if you’re using VDI to secure access or data or apps.
If VPN or proxy services are being used to access corporate resources from Azure Virtual Desktop, you should deploy synthetic tests in each region where you have AVD users. Synthetic testing of VPN or cloud proxies will let you detect if there are problems before users complain, and better able to isolate network or server issues when there is a performance issue. Any slowdowns detected by the synthetic sensors can be configured for alarming and integrated into incident management systems to reduce the incident response time. This allows you to get ahead of issues and communicate out to the teams that may be affected.
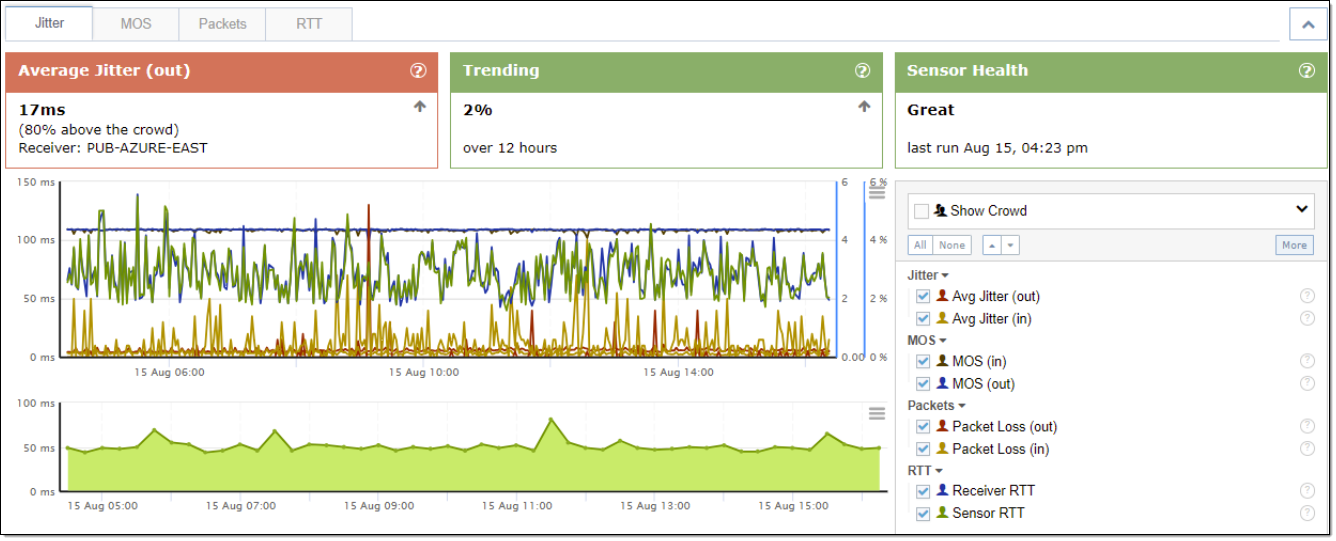
The recommended VoIP, Bandwidth, and Web Login (or WGET) sensor tests can be configured in many ways to accomplish proactive testing goals:
- Peer-to-peer VoIP sensors from an AVD instance to a corporate peer
This will test UDP protocol performance from the cloud to the corporate network, including SDWAN environments. Depending on how you have Telephony configured or collaboration solutions, this will provide early detection of conditions that your employees rely on. - VoIP or bandwidth sensors to Exoprise supplied public cloud locations in Amazon Web Services or various regions in Azure
Using these synthetics, you can test response times to where you might have web or security applications, even UCaaS dependent applications. - Web Login or WGET sensors to homegrown or hosted web applications
A Web login sensor is script-free and doesn’t require maintenance to test the network paths and application uptime. Exoprise excels at proxy or SASE compatible tests from a VDI environment.
Service Watch Active Test
There is another new feature of Service Watch Desktop, called Active Test. Active Test can perform continuous lightweight synthetic tests from the same agent that is collecting real-time application and system performance. Service Watch Active Test (SWAT) can be used to test VoIP, Web, DNS, or network ping performance from the same desktop that the user is running while not impacting the system or user’s performance. This combines true proactive monitoring with real-user monitoring. Active Test is perfect for VDI as well as for home or remote users.
By deploying Active Tests, you will have proactive tests that let you know about problems before your user has a business critical call. If you wait until when the user is on a call before you detect network issues, then it’s too late. Active Test provides a reliable baseline for quickly seeing if a user is having an end-to-end problem.
We’ve heard from customers that deploying these network sensors or even SWAT’s bandwidth and VoIP options has sped up detection and resolution times. Whether they are testing the traffic through a VPN from an office to a data center or office to a hosted machine, they found it has a significant return on investment when it comes to diagnosing user reported problems. The key when deciding on deployment is coverage, make sure these sensors or SWAT are running in the right offices and for the right users.
When deciding on your deployment, consider which offices typically have the most users working out of them. You also need to consider different network configurations that are in place. You really want your sensors running from the same networks that users are connecting to for a representation of their experience. Deploying to networks that are not being used by the end users will not provide you with the real users experiences due to security or even routing policies.
With Service Watch Active Testing, the option to deploy to your “squeaky wheels”, as we like to call them, is available. Instrumenting every device will provide you with better coverage and more data points. This is always helpful information when troubleshooting or optimizing environments, but this isn’t always possible for some organizations. Also consider deploying Service Watch Active Testing to remote users for visibility into poorly performing home networks, ISP, and more.
Happy proactive monitoring!
Related Posts


