With every webpage loaded, email sent, or video streamed, network traffic takes a complex journey…
Businesses today are increasingly dependent on Single Page Applications (SPAs) for better user experiences. A Single Page App is when a user loads a web document and the application then updates different parts of the page with background requests. This is opposed to the more traditional Multi-page Applications (MPAs) where each click loads a different web document. Like the way you’re (hopefully) reading different pages on this web server.
SPAs gained popularity for seamless interactions, dynamic updates, and improved responsiveness. However, the transition from traditional web apps to SPAs comes with its own set of performance and reliability challenges. To ensure good user experiences, different monitoring techniques are needed for Single Page Web apps.

Apps like Gmail, Salesforce, and Outlook Web App are used throughout the day by millions of business users. Today, custom Single Page Apps are often developed and delivered by advanced IT teams. To achieve satisfaction, understanding the performance is essential. Service Watch Browser is one such tool that can track the performance of SPAs and provide valuable insight into any issues or outages.
This article will examine the use of both synthetic and real-user monitoring (RUM) for monitoring SPAs. Exoprise’s Service Watch Browser, combined with CloudReady synthetic monitoring, offers data analysis and collection to properly monitor SPAs.
Understanding Single Page Applications (SPAs)
A Single Page Application (SPA) is a type of web application that operates within a single HTML page. It uses JavaScript and background web requests to dynamically update content. Unlike traditional web applications, SPAs load content dynamically instead of retrieving pages from the server for each interaction. This eliminates the need to refresh the entire page and enhances the user experience.
One advantage of SPA architecture is that it creates a more fluid and intuitive user experience while improving performance by reducing network latency. However, SPAs also present their own challenges in ensuring consistent digital experiences.
With SPAs, a user’s computer performance becomes more important than with traditional web apps. Continuous use of one or more SPAs throughout the day can lead to increased memory usage and higher CPU consumption in the browser processes and browser overhead. This can be observed through multiple Chrome or Microsoft Edge processes occupying a significant amount of memory (oh boy, there are plenty of processes when web browsing).
Even with sufficient memory, browser caching, and a well-equipped computer, applications like Salesforce Lightning, or Outlook may experience slow performance as the day progresses. Thus, managing and monitoring memory overhead and CPU overhead becomes a critical priority.
Challenges to Monitoring Single Page Applications
As noted already, monitoring SPAs can be challenging, especially with traditional IT tools. Let’s dig into some specific instances where these challenges arise.
- Commonly, Dynamic Content Loading presents a challenge for monitoring conventional metrics like page load times due to the asynchronous nature of Single Page Applications (SPAs). Content is loaded dynamically in the background through a fetch or XHR request, typically in response to user interactions. To ensure effective performance tracking, it becomes crucial to focus on specific components and interactions rather than measuring the entire page load. Response times for the dynamic content must still be ascertained from the web browser.
- Additionally, SPAs simulate page navigation using client-side routing, which keeps users on a single HTML page. These page navigations can be complex, involving multiple API requests and rendering processes. Monitoring the performance of these interactions is crucial for identifying potential bottlenecks in the user journey.
- Meanwhile, tracking the execution and performance of client-side scripts is essential for SPAs due to the significant role of JavaScript. Errors or slowdowns in script execution may negatively impact user experiences.
For these reasons, adequate Real-User Monitoring (RUM) is imperative to optimizing Single Page web applications, as well as identifying where issues exist.
Benefits of Monitoring Single Page Applications
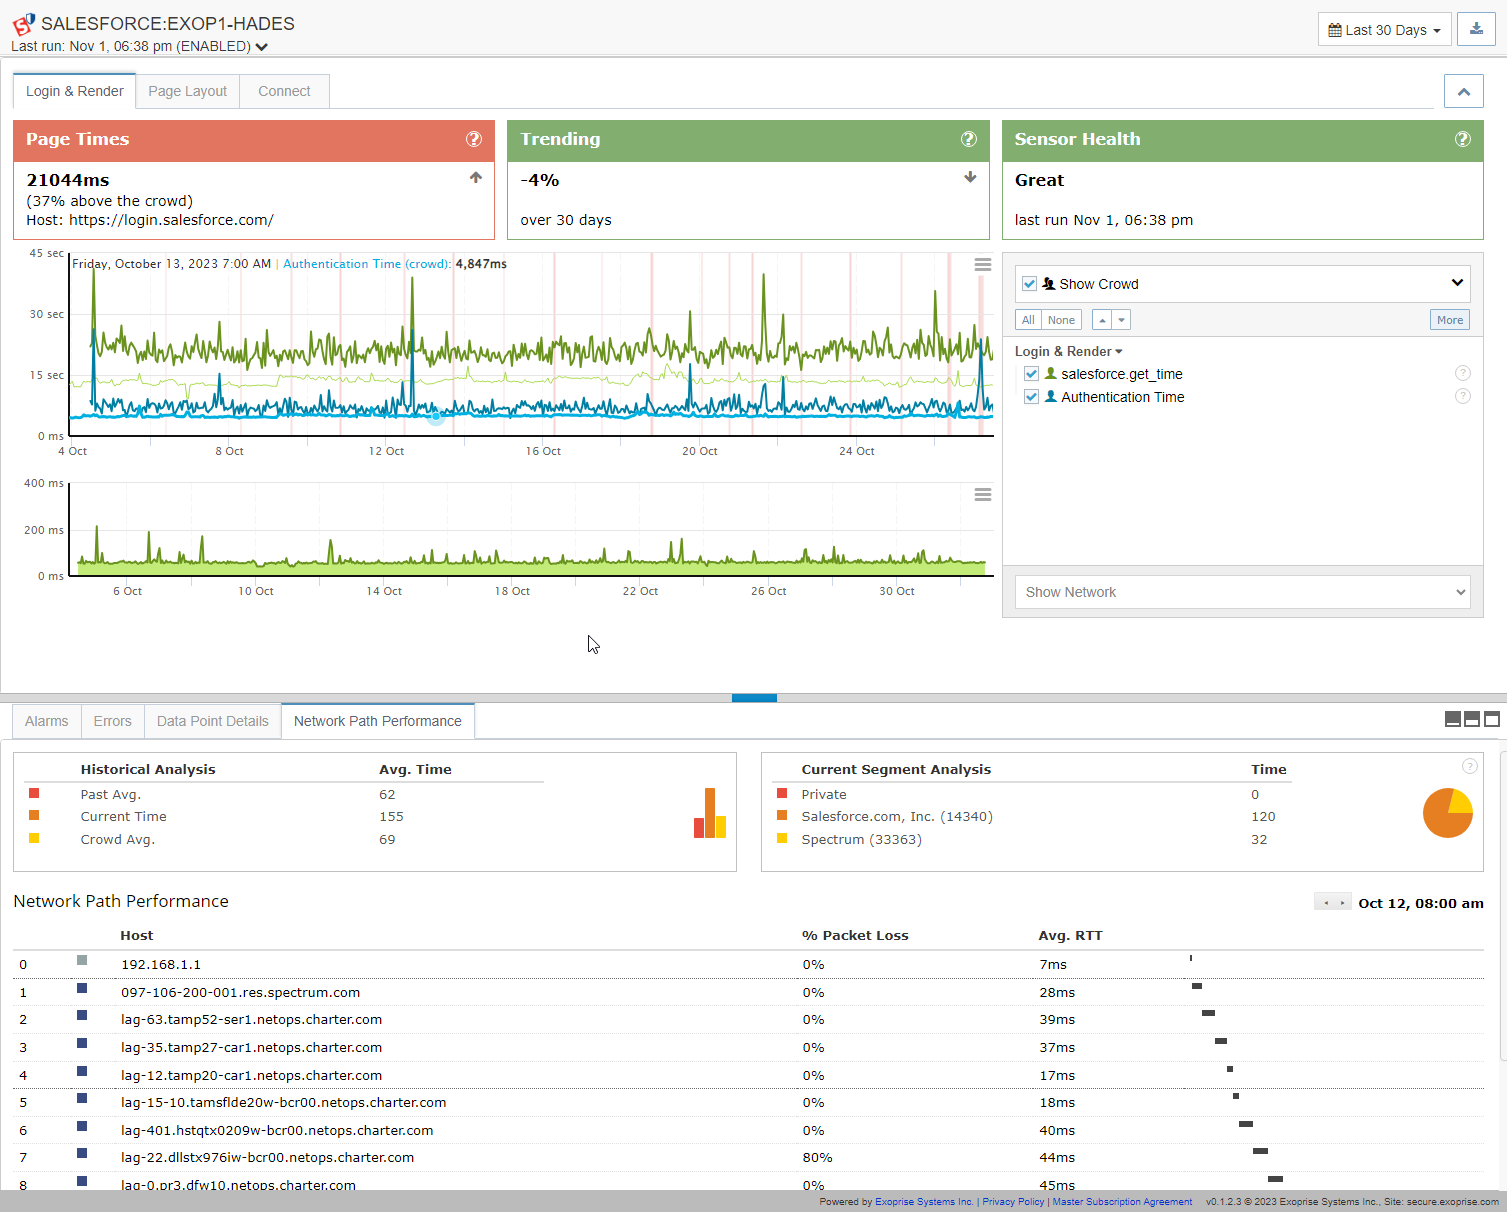
Synthetic Transaction Monitoring with CloudReady
CloudReady already provides various scriptless SPA sensors for Microsoft 365 and third-party applications like Salesforce and SharePoint, to name a few. Here’s how these synthetic tests can be used to monitor service-level agreements and ensure that the Single Page Applications are being accessed correctly:
- End-to-End User Experience Simulation
Synthetic monitoring simulates user interactions and journeys, enabling businesses to understand the application’s behavior from a user’s perspective. It mimics typical actions and tests critical workflows, providing valuable insights into the performance and usability of SPAs. - Performance Optimization
Synthetic monitoring helps identify performance bottlenecks, optimizing loading times, response rates, and rendering processes. This allows businesses to proactively enhance the responsiveness and overall user experience of their SPAs. - Error Detection and Diagnosis
Synthetic monitoring actively monitors for errors, exceptions, or anomalies in SPAs’ behavior. The ability to capture and diagnose errors in real-time helps businesses identify and resolve issues before they impact actual users. - Scalability and Load Testing
Synthetic monitoring allows businesses to simulate user loads and stress test SPAs, ensuring they can handle increased traffic without compromising on performance.
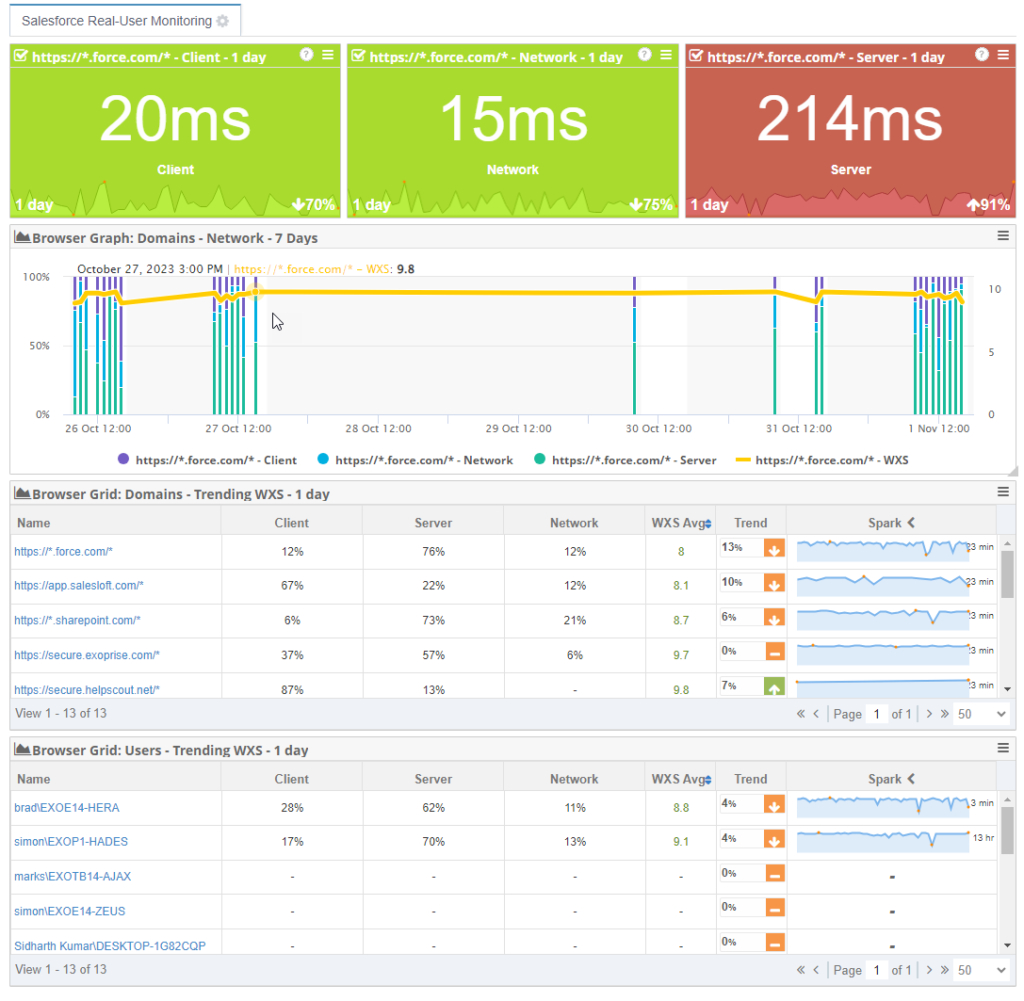
Real-User Monitoring with Service Watch Browser
Exoprise’s Service Watch Browser combined with Service Watch Desktop leverages a browser add-on as well as a local agent to continuously monitor the use of rich web applications. The benefits of using the Service Watch Browser add-on are:
- Individual devices are monitored to identify the source of issues, whether it be the client, server or application host, or network. IT support staff can quickly diagnose where a problem or slowdown might stem from for different business apps.
- Exoprise aggregates anonymous datasets of information, which enable the creation of larger benchmarks. Businesses can assess service level violations in SPAs and recover credits for outages and errors.
- Digital experience metrics for SPAs you don’t own are easily captured for unmatched visibility into performance at all levels, with pinpoint accuracy for determining where bottlenecks exist.
- Service Watch Browser is a RUM browser add-on included as part of Service Watch Desktop and can be easily deployed to IT defined applications.
- All OS types are supported, and deployment is conveniently available through web stores, stand-alone installers or as part of the Service Watch Desktop implementation.
- All SPAs are covered through user browser interaction.
- Finally, Service Watch Browser interacts with the Exoprise desktop agent to pinpoint where in the network path between the users device and the target SaaS app is the cause of latency
Exoprise Service Watch enables businesses to achieve effective RUM by addressing digital experience issues at every level. IT support can respond decisively and quickly. Businesses can easily acquire the necessary information to assess SPA performance and meet fiscal and operational goals.
Resources for Single Page Application Monitoring
Discover more about Exoprise solutions and ease of implementing them:
Service Watch Browser datasheet
CloudReady All Sensors Overview
Exoprise Intro: Synthetics + RUM in One Platform
Troubleshooting Salesforce Video
CloudReady Synthetics + Service Watch RUM Video
Conclusion
Real-user monitoring and synthetic testing provide crucial components of any successful Single Page Application monitoring strategy. These components enable businesses to proactively identify and address performance issues while users experience high satisfaction with IT delivered applications.
By deploying Service Watch Browser and pertinent CloudReady sensors, businesses ensure seamless interactions, enhance reliability, and deliver exceptional user experiences.
Related Posts


