With every webpage loaded, email sent, or video streamed, network traffic takes a complex journey…
How CloudReady helps you detect, quantify, and report on
service level issues for your cloud apps and services
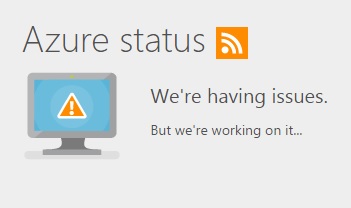 A couple of days ago Azure US West experienced a fairly significant service outage lasting several hours. While none of the CloudReady back-end services were impacted, some of our testing and demonstration VMs were.
As we’ve highlighted in previous posts, going to provider health dashboards generally only provides you with limited and often delayed information, and in this case the Azure Status page was no different.
In situations like this Azure outage, customers often ask us how they can leverage CloudReady to help them manage their cloud vendor SLAs. After all, if you have a revenue generating or other mission critical service relying on a 3rd party cloud application or service, you need to be able to measure and at least report internally on service level attainment and in some instances hold your providers to account for lost service time.
SLA management for any cloud service is definitely important, but just as important is being able to differentiate between actual app or internet service provider outages and service interruptions that result from internal network or configuration problems. You don’t want to waste time complaining to Microsoft or Salesforce, only to find that the problem was really your firewall configuration. Fortunately, with CloudReady you can achieve both of these goals easily.
Step 1 – Detect
Let’s first start with detection. Obviously, as an admin you want to be notified immediately in the event of a service disruption, so you can quickly respond. CloudReady synthetic test and alarms enable you to do just that. In this case, because we are running a CloudReady monitoring site on Azure West, we received a SensorOffSchedule alarm within a couple of minutes of the beginning of the outage.
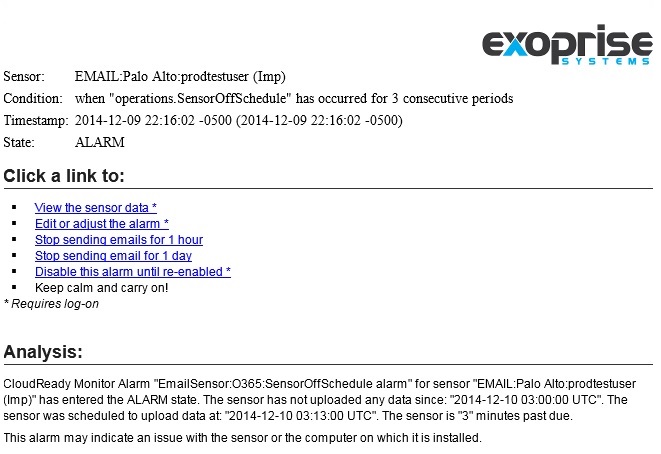
After receiving this alarm, we first logged into CloudReady where we could see that all the sensors on that site were not functioning and could initiate investigation immediately (testing our ability to log into the VM and confirming that the problem wasn’t something we could fix) well before the Azure status dashboard was updated to acknowledge the problem.
Step 2 – Quantify
Early detection of service interruption is obviously critical, bit for SaaS SLA management, it’s equally important to be able to identify as precisely as possible the exact beginning and end times of the interruption. The bigger the issue, the more people in your organization are going to want to know the specifics of the duration and user impact. In this case, the initial ALARM message as well as the RESOLVED message received when the VM/site was back online provided our team with this information. It is also visible within the sensor detail page for any sensors running on the affected site.

You can see the long gap in measurement times for this sensor running on our Azure US West site, indicating when the sensor was last able to report back to the CloudReady service on at 10 PM on December 9th, and when it was again running and able to test and send measurements at 4 PM on December 10th.
Since this outage disabled the CloudReady site itself, all sensors on the site were affected, and their graphs show a similar gap. If this were instead an outage for an individual app/service being monitored from this site, a) we would have instead received LoginError or other transaction alarm messages, and b) the trend line graphs would continue to show measurements data during the outage, but with a distinct shift in local and/or crowd response times (depending on the scope of the problem).
In this case, it was pretty easy to confirm the source/scope of the outage. Everything, including the Azure Status page, pointed to Microsoft. However, often it is not so easy. Most outages are local or in the ISP network chain, so it is important to look across multiple sensors and sites, and most importantly, the crowd data. Sometimes a local or ISP problem can initially look like as general application problem, until you look at it from multiple angles. CloudReady makes that easy.
Step 3 – Report
It’s fairly common for IT teams to run an impact analysis on any outage, to quantify the business impact, roll-up scorecard metrics, and identify ways to avoid the problem going forward. In the case of public cloud apps and services, the IT team may additionally want to pursue reimbursement under the terms for their Service Level Agreement with the app, service, or network provider. CloudReady provides a number of ways to extract the data needed for this analysis and reporting.
Alarm Emails – The alarm emails mentioned above have good information indicating the exact timings of the outage events, and for performance alarms, the actual response times that triggered the alarm.
Sensor Data Export – Each sensor detail page provides the option to download the sensor data (for a specified time period) in either CSV or PDF formats. The CSV data exports are particularly useful for showing app response time degradation at a particular relative to other site, application, network and crowd data measurements.
Sensor Availability Reports – Each sensor detail page also provides the ability to view a summary of service availability for the past 30 or 90 days. You access these reports by clicking the “Availability” link in the Sensor menu. The Availability Report includes a number of graphs summarizing daily service availability, error, and alarms (including alarm durations).
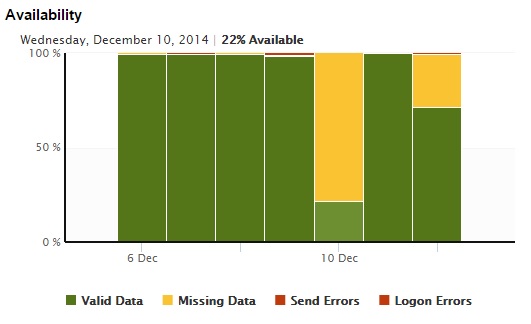
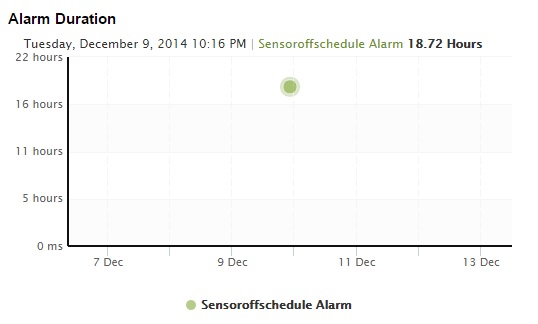
It’s important to note that these graphs represent the measured availability of the end-to-end service from that particular site/sensor, not the availability delivered by a particular provider. As we’ve described previously, there are a lot of potential points of failure between your users and the SaaS app servers. By themselves, these graphs can only answer the question, “How are we doing accessing apps from this location?” However, when combined with the Alarm Emails and Sensor Data Export, they provide a good summary for communication internally and/or with your service providers.
Visibility and control is challenging for SaaS apps and services, and it’s not uncommon for organizations adopting them to feel they’re flying completely blind with no ability to reliably monitor and manage service levels. With CloudReady, and the power of the crowd, this doesn’t have to be the case. It’s just a matter of making sure you are monitoring your critical cloud apps from your user locations.
