With every webpage loaded, email sent, or video streamed, network traffic takes a complex journey…
Service Watch Real User Monitoring (RUM) Reigns
Are you looking to do real user monitoring?
Service Watch for Real User Monitoring has come a long way. Our last product update announcement talked about new layouts for Service Watch Browser and Service Watch Desktop. These new layouts and widgets provide IT with a holistic end-user experience score. If you use business apps from home, the experience is often not the same as working from the office.
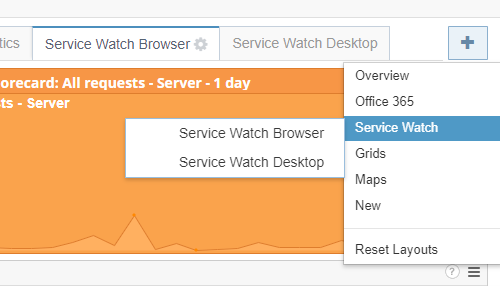
Service Watch closes this gap with its browser and desktop passive monitoring. The solution enables IT to collect 1000’s advanced metrics for accelerating troubleshooting. Existing CloudReady synthetic customers can easily install the built-in Service Watch layout. In the Dashboards section, click the ‘+’ button on the right-hand side to start deploying Service Watch.
Real User Monitoring for Microsoft 365
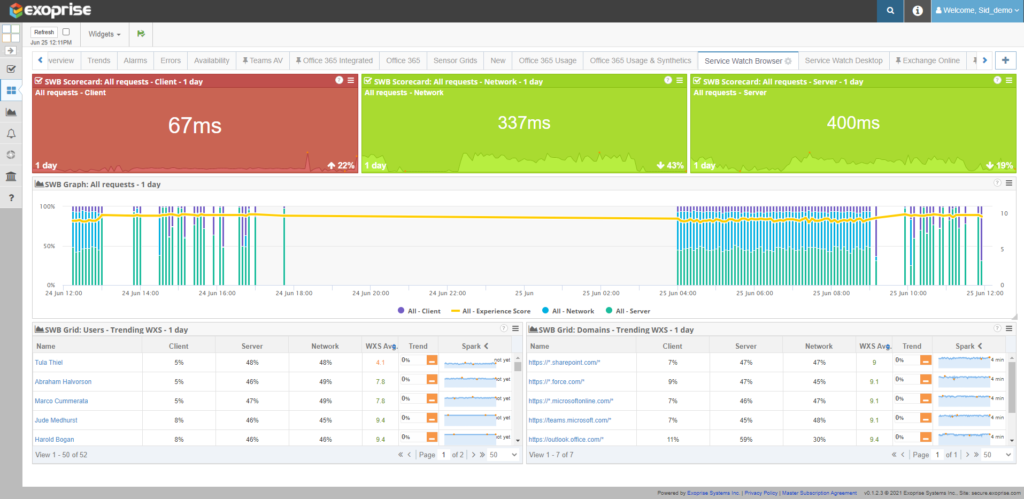
Within Service Watch Browser, end users can add three widgets to the layout.
- The Service Watch Browser scorecard provides a quick visualization of a single metric (client, network, server). Under Settings, configure the widget to display transaction data for all requests or specific domains/users. Select a suitable time (days or hours) to be included in the layout.
- The Service Watch Browser Graph provides a trend chart for each of the metrics selected under the settings. For each data point, end users can compare multiple Service Watch metrics for requests by domain, user, or all.
- The Service Watch Browser Grid displays all the Microsoft 365 application (SharePoint, Teams, OneDrive, Exchange, Office, etc.) web pages that need monitoring, as described in our previous blogs. The grid provides a tabular representation of all requests served from the client, server, and network.
How to Do Real User Monitoring for the Web
Service Watch Browser helps IT quickly diagnose network, SaaS, or web application problems for HQ, branch, and WFH real users by analyzing Web Experience Score (WXS) trends.
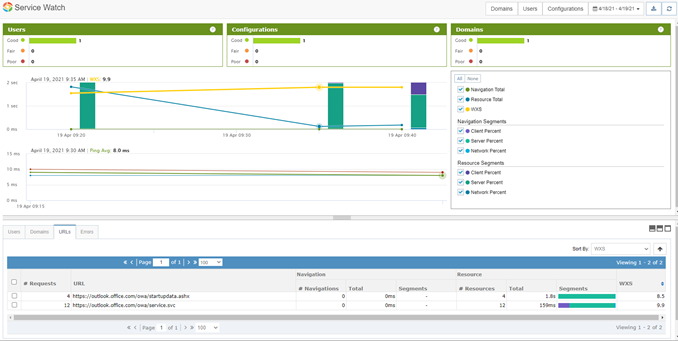
For example, consider the layout above showing that a client response time via a Google Chrome or Microsoft Edge browser takes 67 milliseconds, a jump of 22 % in a single day. Clicking on the SWB scorecard provides further insights into this behavior, as shown below. Around 9.20 am; the generated WXS was 8.5 below the average of 9.9. Client resource utilization at this time is about 1.8 seconds. A further examination under the URLs tab shows which page consumes the most resources, thus resulting in a higher download time for the client.
Administrators can also pair Service Watch Browser with an existing Exoprise Private Site for hop-by-hop Network Path Performance. This is a powerful solution for branch offices where you quickly invite and deploy the Exoprise Service Watch Browser Extension to users and then configure it to leverage a single private site for slow ISP / Network detection.
Running a handful of synthetics on the private site provides the best of all worlds; synthetic monitoring for proactive problem detection and RUM browser extensions for complete coverage of any individual user issues. This is a frequent scenario for our customers so far as we’ve brought Service Watch to market.
Endpoint Real User Monitoring for the Microsoft 365 Desktop Teams App and Others
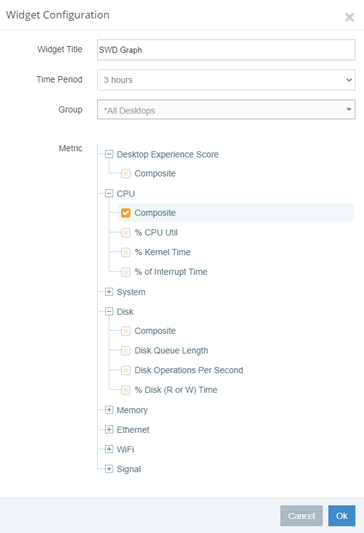
Service Watch Desktop RUM collects session data from endpoint devices to diagnose Microsoft 365 apps, services, resources, and network problems. Within Service Watch Desktop, you can choose from a large set of critical system resource metrics such as CPU, disk, memory, Ethernet, Wi-Fi.
Furthermore, these metrics are scored, put into Good, Fair, and Poor buckets, and further composited and aggregated for high-level ranking. This enables IT administrators and support staff to quickly see the machines and users with the most pressing issues first whether it’s a system, application, network, or resource problems.
Configure each widget for a specific period or group of devices in the company. Service Watch Desktop includes the Desktop Experience Score (DXS) to measure the overall digital experience of employees using applications such as Microsoft Teams, Zoom, Salesforce, etc.
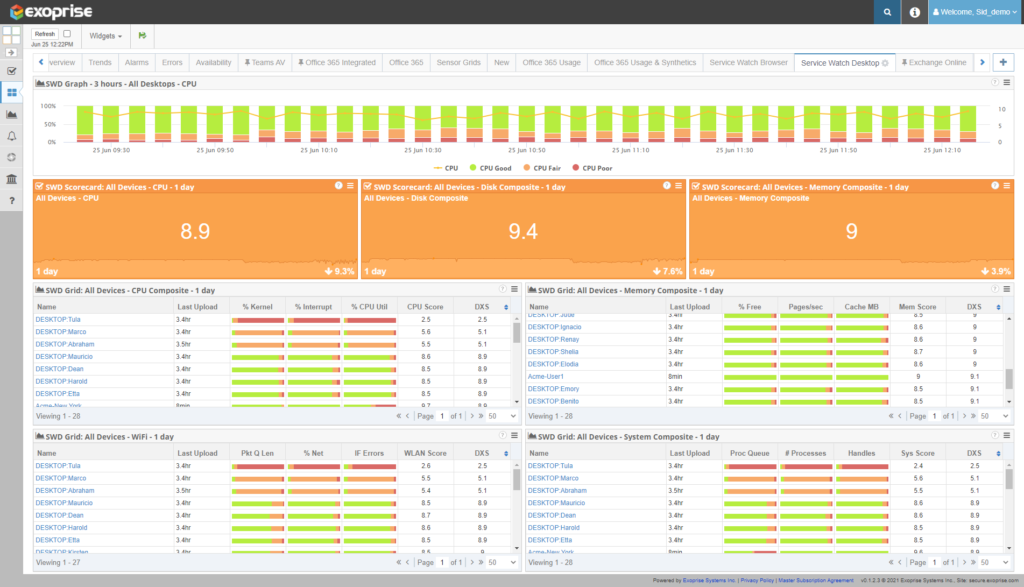
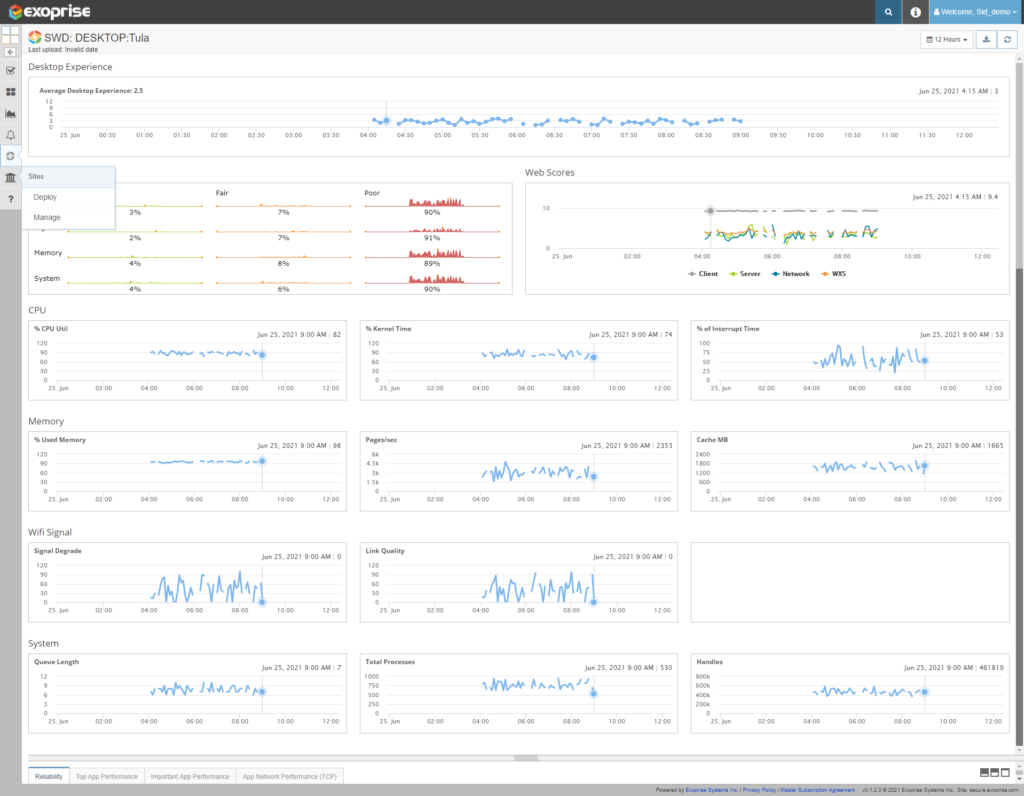
The Service Watch Desktop Real User Monitoring dashboard provides a summary of the health status of all employee machines. This view supports a large workforce working remotely due to the pandemic. Selecting a particular user provides low-level details of all their composite metrics.
Moreover, a corresponding WXS is also available for compelling data correlation. When you have more users, our dashboard becomes useful for resolving real user issues.
Best Practices to Improve Digital Experience Monitoring
Try Our Free Real User Monitoring Tool to Optimize the End-User Experience
Depending on your Microsoft 365 or SaaS monitoring needs, Exoprise can help you.
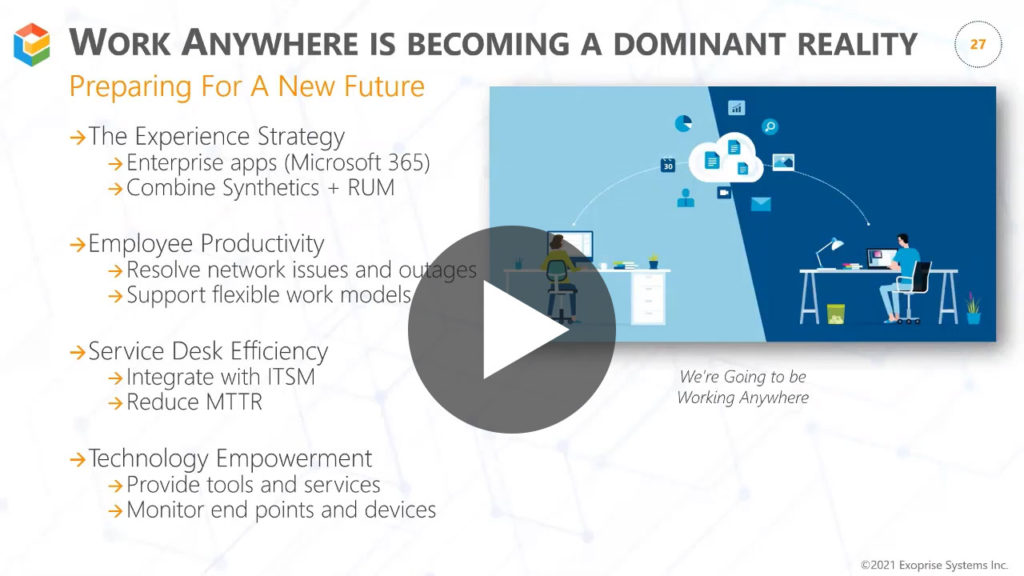
According to Forrester, employees will work from home or branch offices in the future. So, companies will invest in tools to provide proactive coverage and quick troubleshooting for Microsoft 365, network, and desktop issues.
The better together – Synthetics and Real User Monitoring – solution – optimizes and delivers a superior digital experience. That’s the best real user monitoring tool in town with Service Watch!
While other competitors like Datadog, Splunk, Appdynamics, Pingdom, Dynatrace, etc. offer a real user application monitoring solution, no one comes closer when it comes to monitoring digital experience for Microsoft 365 apps and services.
Don’t believe us? Register for a free 15-day trial. Deploy for free:
- 50 seats of Service Watch Browser and
- 25 seats of Service Watch Desktop
Related Posts


