With every webpage loaded, email sent, or video streamed, network traffic takes a complex journey…
An employee calls complaining about slow response time. Another one has similar trouble. No red lights are flashing on the Network Operations console, so the network is up and running. What is happening? Frankly, it could be just about anything: an overworked router, a runaway process on a laptop, a slow loading web page, or a bandwidth hog at home. The challenge for IT teams is finding the source, a step that becomes much easier when utilizing the Network Path Monitoring that is part of Exoprise’s solutions.
Flexibility is an Internet design strength. Links and routes are configured in real time as bandwidth and capacity fluctuate. This architecture is much more efficient and cost effective than previous rigid network architectures, but has downsides too: it makes diagnosing slow network applications much more difficult. Especially, when combined with employee’s varied work environments and increased utilization of cloud, SaaS, and UCaaS platforms.
When users report slowdowns, the tech team often has no way to determine exactly what occurred. Why? Each transaction follows a unique path, so evaluating actual user performance requires more than just monitoring bandwidth usage. In fact, problems arise for many reasons:
- End-user devices are slow, lack capacity, or need upgrades
- The speed of the local LAN or home network, Wi-Fi connections and Internet Service Provider (ISP)
- The performance of each router along a link
- Bandwidth availability
- Corporate network services such as VPNs, Proxies, and cloud-based SASE solutions (these things have performance consequences)
- Each carrier’s network design
Many organizations lack the tools required to determine which of these items is causing the problem. Therefore, they need to add to their management portfolio.
The Clear Need for Network Path Monitoring
A variety of solutions emerged to take on this complex challenge. The products help corporations see how data is moving over enterprise networks by gathering information as data packets travel from network router to network router. The tools assist administrators in understanding network topology, troubleshooting issues, and optimizing network capacity and performance. Underscoring the issue’s complexity, the different options have similar goals, take various approaches to gathering the performance information, and are grouped differently.
Here are high-level overviews of popular approaches.
Network Path Monitoring, Network Path Performance
These products collect and analyze data about how packets and data flow along network paths – basically the route between two or more points. They examine network path performance items, like latency, jitter, packet loss, and available bandwidth, to establish baselines that characterize network performance.
Traceroute, Tracerouting, Network tracing
These products use the Internet Control Message Protocol (ICMP) to send packets at different intervals to determine the sequence of routers that a packet passes through on its way from the source to the destination. The data illustrates the round-trip time (RTT) for each hop.
Hop-by-hop Discovery, Network Node Discovery.
Hop-by-hop discovery is the process of identifying and mapping all the devices connected to a network. This step helps enterprises build network topology maps, so they visualize what is occurring as users hit the Send button.
Traffic Flow Discovery
Traffic discovery involves identifying and analyzing the flow of data across a network. This includes monitoring and analyzing the source, destination, and type of network traffic to gain insights into network performance, security, and bandwidth usage.
Continuous Network Node Discovery
The most comprehensive approach because it combines a few needed elements. Like the other approaches, Continuous Network Node Capture examines how information on the enterprise network moves but digs deeper and takes a more comprehensive view of the problem.
Synthetic Transaction Monitoring vs Real-User Monitoring
Paired with approaches for dissecting network paths, measuring network performance typically leverages either synthetic transaction monitoring (STM) to emulate data flows, or real-user monitoring (RUM) to passively capture real-time data flows. Few tools on the market leverage both methodologies for a holistic picture and then combine it with techniques for network path monitoring. Exoprise is one of those few companies.
With our CloudReady synthetics, every network protocol can be synthetically emulated and tested for proper baseline capture. Alongside the user and application emulation, a continuous picture of the network hop-by-hop infrastructure is recorded.
And Exoprise Service Watch real-user monitoring captures the latency, packet-loss, and jitter for every core and UC application while it also captures segmented breakdowns of network flows and routers.
The Exoprise platform continuously captures and identifies every Autonomous System Number (ASN) associated with a particular IP address and network segment edge to understand how individual ISP networks operate. In addition, this approach collects data about what occurs at the major peering points, the transitions between the segments and helps to pinpoint the culprits when detecting Internet performance bottlenecks.
Finally, we take the network path data and correlate it with other crowdsourced network performance metrics. Analytics that are layered on top provide insight into network performance by comparing current data to historical performance and deliver a full picture of what is happening. That data paints the picture necessary to see where bottlenecks arise and what is needed to alleviate them.
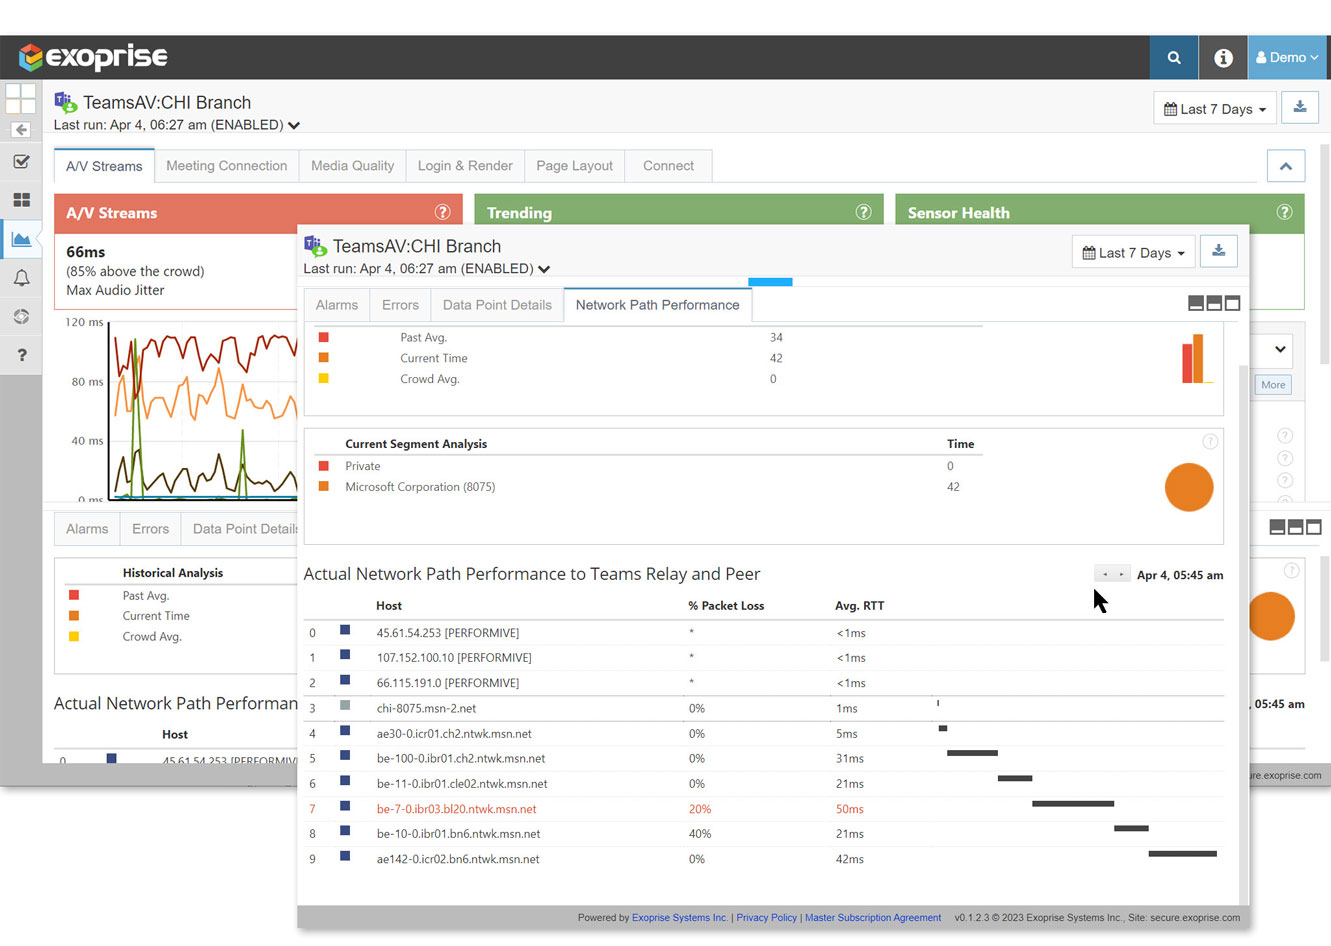
Exoprise’s solutions offer intuitive dashboards that enable system administrators to rapidly and easily determine how different connections function. This is a Network Path Performance analysis for a real-time Teams meeting session from a Work From Home employee. Problem areas are highlighted, so technicians quickly identify them.
In this case, Service Watch illustrates how well an employee’s desktop is processing information. Not only is the performance information displayed, but they also see which carrier network transmitted the data.
Just-in-Time Network Path Performance Discovery
Determining what is happening on an enterprise network is challenging. Exoprise developed solutions that automate data collection and clearly outline performance, so clients provide optimal response times to users. The company delivers industry leading continuous network path analysis via its CloudReady Synthetics and Service Watch real-user monitoring
The two create data points that provide system administrators with the visibility needed to identify and remediate performance problems. Exoprise has synthetic and real-user monitoring solutions for all the leading networked applications like Microsoft Outlook, Teams, Zoom, WebEx, RDP, and Citrix.
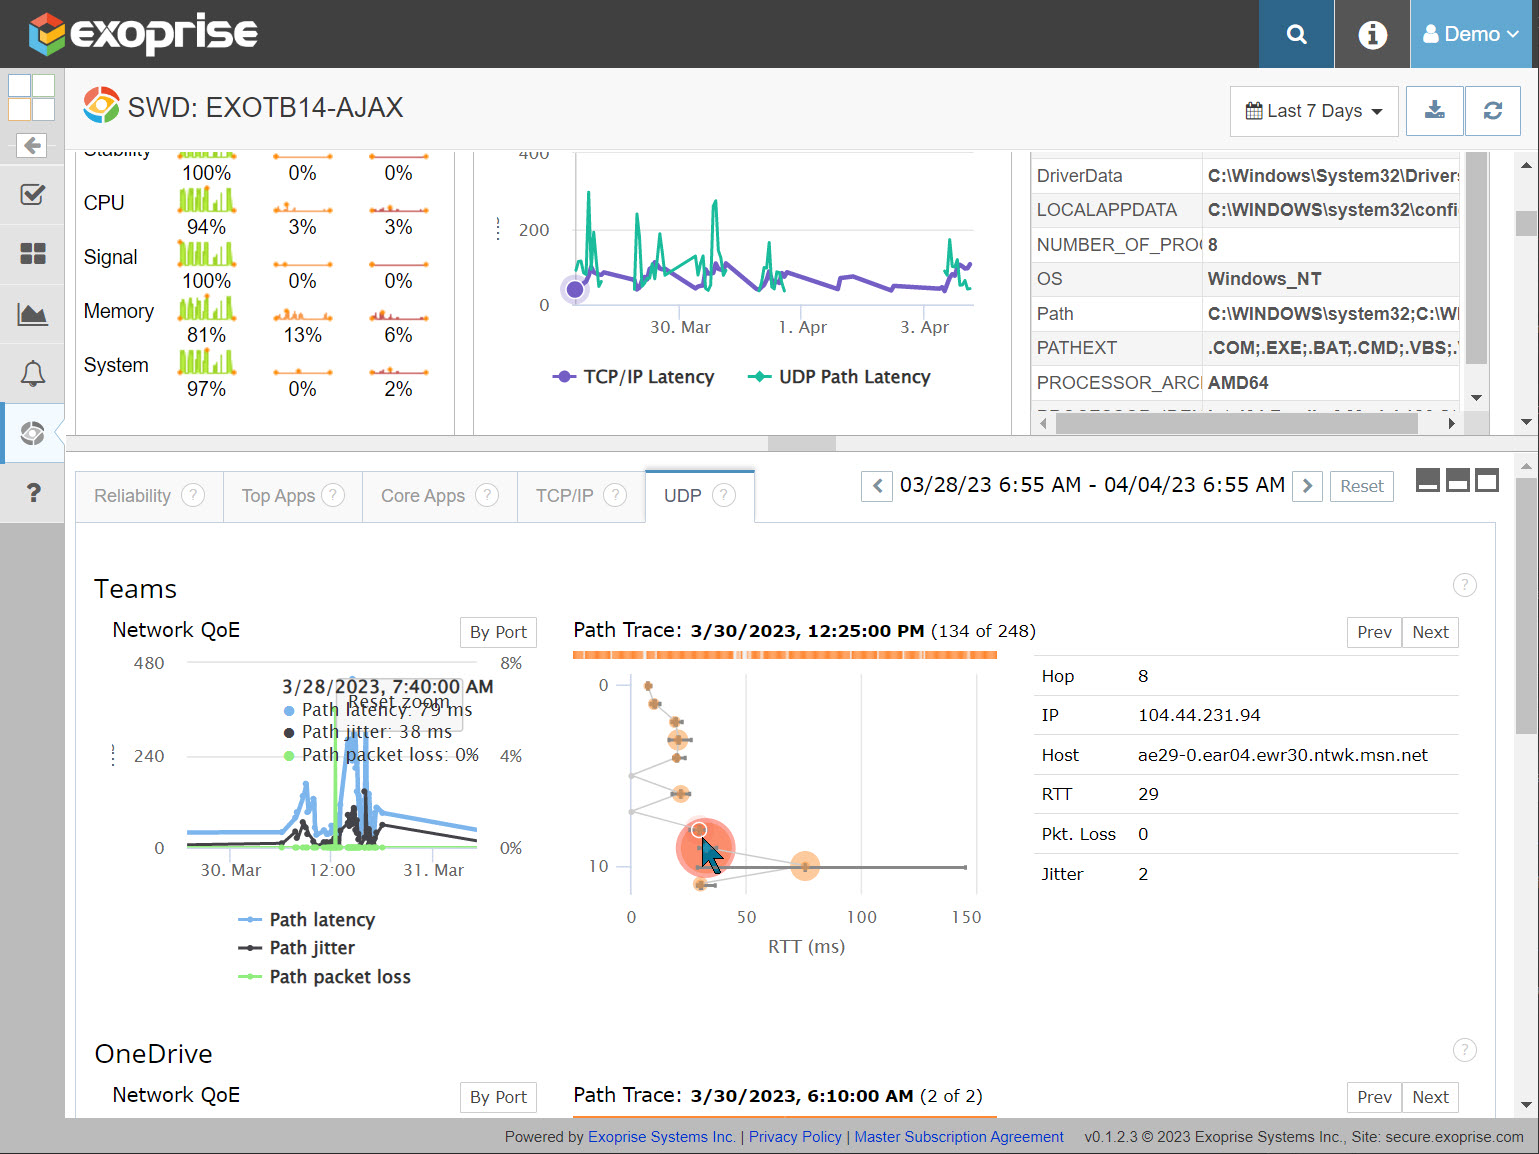
The system administrator recognizes how well the network handles audio and visual transmissions, as well as how network performance is trending.
Infrastructure monitoring is a complex area, one that involves many moving pieces. Slow response times come from a variety of infrastructure issues: packet loss, latency, jitter, Login time, authentication time, and page design. Historically, system administrators had trouble gaining the visibility needed to discern the user experience. Trying to sift through all the potential problems and identify the trouble is a time consuming, tedious undertaking. A Just in Time suite, like Exoprise’s CloudReady and Service Watch, provides metrics in easy-to-follow dashboards that depict system performance and enable companies to create optimal user experiences.
Related Posts


