With every webpage loaded, email sent, or video streamed, network traffic takes a complex journey…
A set of metrics known as Core Web Vitals have become key indicators of website performance and user satisfaction. Monitoring and optimizing these metrics for web pages can be challenging. Today, we learn how to use synthetic and real-user monitoring to measure, analyze, and improve Core Web Vitals. Delivering a smooth user experience plays a pivotal role in determining website application success.
When addressing Core Web Vitals, it’s important to acknowledge that their underlying metrics have a significant impact. Meeting Google’s requirements is important to site performance and is a ranking factor for Google. Ensuring user satisfaction with Software-as-a-Service (SaaS) applications or internally developed business apps also remains a topmost concern.
By optimizing for these metrics, you can enhance the overall user experience, leading to increased satisfaction and engagement. These metrics go beyond just search engine rankings and directly influence end-user’s perception of your application’s performance.
Improving web app performance is crucial to delivering a seamless and efficient digital experience. Improving Core Web Vital metrics enhances user satisfaction. It also enhances the success of SaaS platforms, Single Page Apps (SPAs), and Line of Business (LOB) applications.
Understanding Core Web Vitals
To evaluate a website’s overall user experience, Google introduced Core Web Vitals, consisting of three key metrics:

- Largest Contentful Paint (LCP)
LCP measures loading performance and marks the point where the largest element is rendered on the page - First Input Delay (FID)
Assesses interactivity by measuring the time taken for a user’s first interaction - Cumulative Layout Shift (CLS)
Quantifies visual stability by analyzing unexpected layout shifts during page load
Google created core web vital metrics to induce website operators to minimize page load times and enhance customer satisfaction. The same metrics should apply to SaaS apps and will impact the employee experience.
Re-visiting Synthetic Monitoring
Synthetic monitoring simulates user interactions with a website to measure various performance and reliability aspects. It utilizes agents, often called robots (bots) or “synthetics,” to replicate user journeys and report performance data. Unlike real-user monitoring, which captures data from actual users, synthetic monitoring provides controlled scenarios and consistent results. Hence, it is a valuable tool for optimizing Core Web Vitals.
Leveraging Synthetic Monitoring for Core Web Vitals
Synthetic monitoring enables website owners and developers to continually monitor and assess Core Web Vitals. Here’s how synthetic monitoring can be effectively utilized:
- Consistent Performance Measurement
By scheduling synthetic tests at regular intervals, Core Web Vitals can be measured consistently across different user scenarios. These tests enable early issue detection and swift troubleshooting. - Geo-Distributed Monitoring
Synthetic monitoring allows you to assess Core Web Vitals from various geographic locations. Insights into regional performance differences provide better targeting of optimization efforts. - In-depth Support for Debugging
With synthetic monitoring, you gain access to granular data, including detailed waterfall charts and network traffic analysis. Such insights facilitate effective debugging of performance bottlenecks related to LCP, FID, and CLS.
Implementing Synthetic Monitoring for Core Web Vitals
To successfully deploy synthetic monitoring for Core Web Vitals, consider the following steps:
- Code-free Synthetics
Exoprise offers script-free synthetic monitoring. This helps avoid the difficulties of maintaining scripts that interact with websites. It also helps measure Core Web Vitals. - Use a synthetic monitoring tool
Exoprise provides coverage synthetic monitoring with its CloudReady synthetic monitoring. - Configure Synthetic Scenarios
Customize synthetic tests to assess specific Core Web Vitals, modifying to match the precise user interactions within your website. - Establish Alerting and Notifications
Receive alerts when a Core Web Vital metric exceeds set limits to quickly fix performance problems and reduce impact on users.
Maximizing Insights and Optimizing Core Web Vitals
Synthetic monitoring alone is not sufficient to enhance Core Web Vitals. It serves as a catalyst for affecting performance improvements. Consider the following strategies:
- Perform Comparative Analysis
Utilize synthetic monitoring to compare Core Web Vitals between different website versions or variations. This allows you to identify changes that positively or negatively impact performance. - Constant Optimization Iterations
Use synthetic monitoring to analyze various optimization techniques and their impact on Core Web Vitals. Continual iteration and measurements will help you fine-tune your website’s performance over time. - Collaborate with Actual Users (RUM)
While synthetic monitoring provides invaluable insights, always consider real-user monitoring to capture diverse user experiences and identify potential issues that synthetic monitoring might miss, which leads us to the next point: RUM.
RUM As The X-Factor
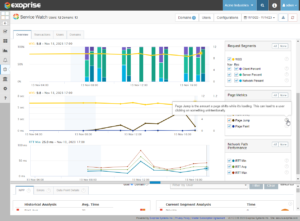
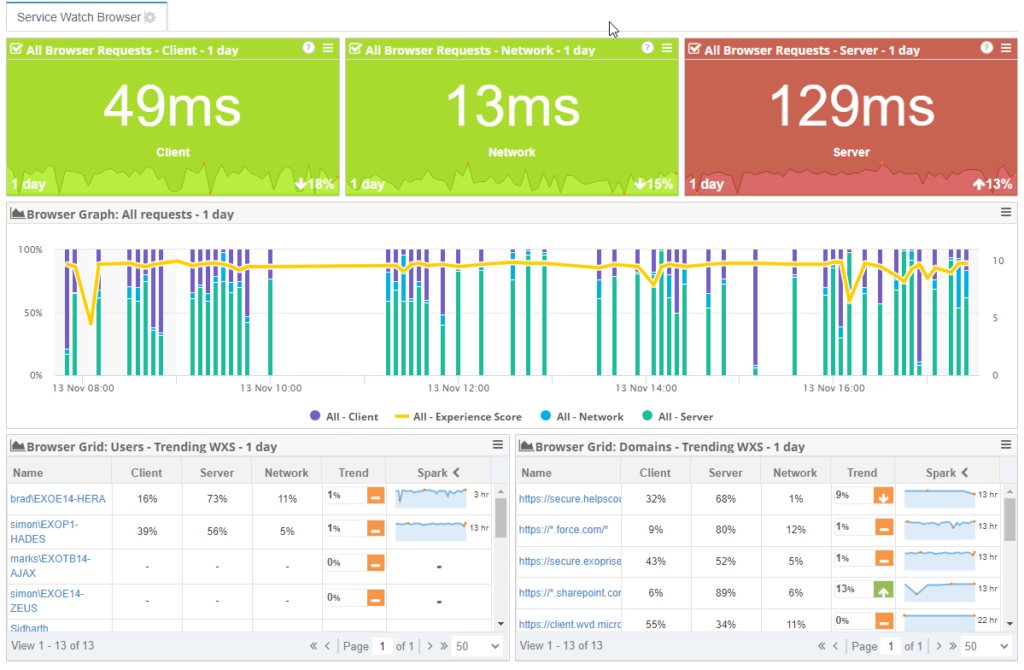
While synthetic monitoring is valuable, Exoprise also offers real-user monitoring (RUM) through their Service Watch Browser add-on as an additional layer of monitoring for SaaS and custom apps.

The Service Watch Browser add-on is easy to deploy and captures performance information that is relevant to web performance. Exoprise aggregates this information to provide performance measurements at both the client community and organizational levels, the latter including individual devices. These measurements offer a wealth of performance data for the key metrics of Core Web Vitals (Largest Contentful Paint, First Input Delay, and Cumulative Layout Shift) for both Software-as-a-Service (SaaS) and Single-Page Applications (SPA).
With the Exoprise browser add-on, support organizations can monitor metrics for commonly used apps. Service Watch Browser makes it easy to track performance issues for specialized apps developed in-house or provided by third-party vendors. Service Watch makes it easy to diagnose performance issues across all employees or at an individual level.
Combining synthetics with the Exoprise browser add-on (RUM) enhances support for important web apps at all levels. More importantly, developers can use the information to improve web app performance for further UX satisfaction. Results directly affect improved user satisfaction, the most important metric of all.
See these links for related information:
https://www.exoprise.com/products/service-watch-browser/
https://www.exoprise.com/wp-content/uploads/Exoprise-Service-Watch-Browser-Datasheet.pdf
https://www.exoprise.com/2021/01/19/service-watch-browser-monitoring-dem-solutions/
https://www.exoprise.com/2018/09/21/service-watch-real-user-monitoring-office-365-saas/
https://www.exoprise.com/resources/troubleshooting-salesforce-with-exoprise/
Conclusion
Synthetic monitoring presents a potent solution for measuring, analyzing, and enhancing Core Web Vitals. By consistently measuring performance, debugging issues, and guiding optimization, synthetic monitoring helps achieve superior website performance and user satisfaction. Combine it with real-user monitoring for a comprehensive understanding of Core Web Vitals and to instill confidence in your website’s performance. Embrace the power of synthetic monitoring to unlock the full potential of your online presence and stay ahead in the ever-competitive digital landscape.


