
With every webpage loaded, email sent, or video streamed, network traffic takes a complex journey…
Remote workforce management is driving the business landscape, requiring cloud-based tools for monitoring to maintain productivity and user satisfaction. Real-User Monitoring (RUM) and synthetic transaction monitoring are powerful tools that enable organizations to diagnose and fix network issues faster for their employees wherever they work.
In this blog post, we will highlight how to build remote workforce dashboards, exploring how real-user monitoring can be used to solve employee network, productivity, and application problems.
Understanding Remote Workforce Dashboards
Remote workforce dashboards enable organizations to gain insights into the digital experience of remote employees – especially their remote networking response and experience. These dashboards collect application and network telemetry data, providing real-time information on metrics such as latency and overhead for VPNs, SaaS, or Unified Communications (UC) apps.
These metrics are tracked to ensure optimal visibility and proactive monitoring of IT provided services and apps. Via Exoprise CloudReady, Service Watch and Service Watch Active Test (synthetic monitoring from user’s endpoint) IT administrators can reduce cost and provide exemplary support.
With the Exoprise monitoring suite, organizations detect performance issues related to Microsoft 365, Salesforce, Google Suite, or specific SaaS apps. This allows the identification of problematic applications causing user issues, helping to focus efforts on resolving outages and performance slowdowns promptly.
The overall Digital Experience Score (DXS), derived from Exoprise’s Service Watch Desktop metrics and analysis, provides an overview of the user experience as it relates to the device, applications, and Software-as-a-Service access. For IT administrators and support personnel, the scoring highlights and prioritizes:
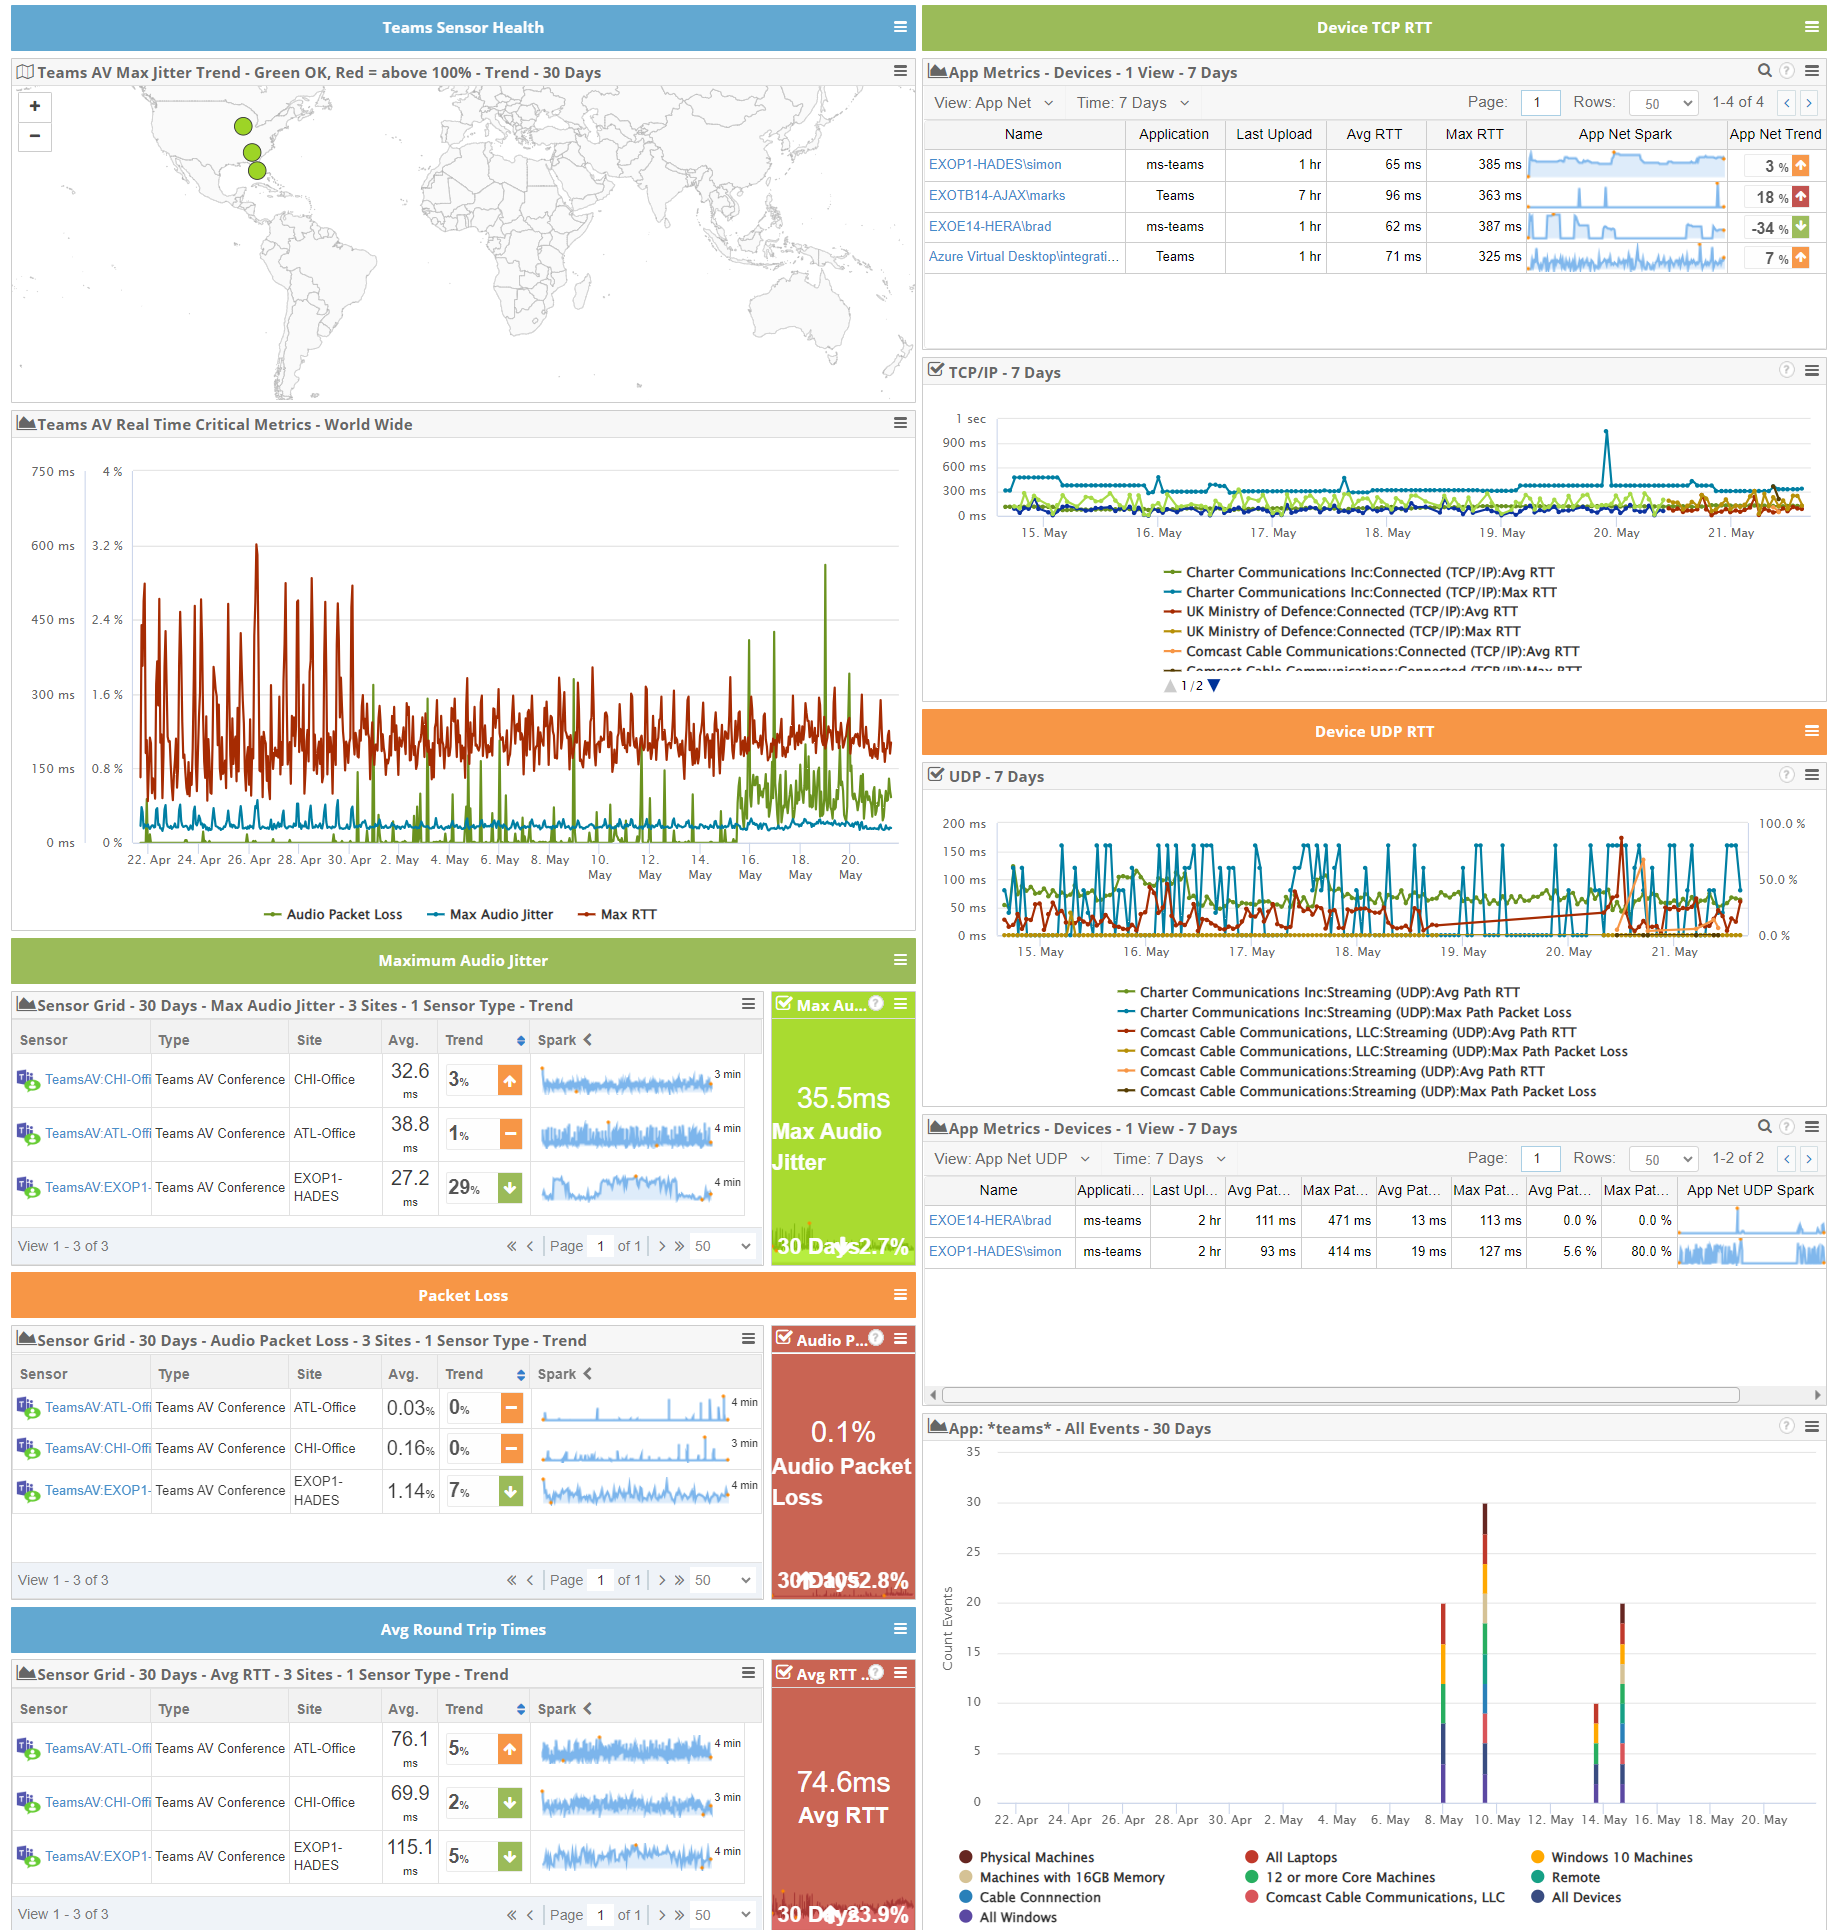
- Geographical Insights
Remote workforce dashboards incorporate regional maps to pinpoint areas of concern. By analyzing incidents related to specific ISPs or their network segments, organizations can prioritize efforts and allocate resources accordingly. This geographical view identifies regions experiencing connection issues or poor application performance, aiding in proactive troubleshooting, and optimizing the remote workforce’s productivity. - User-Centric Approach: Addressing Individual Issues
Remote workforce dashboards facilitate personalized support by highlighting specific users experiencing issues regardless of whether they work in the office, branch, at home, or on the road. By identifying these users and the nature of their problems, organizations can prioritize support resources, ensuring prompt resolution. - Analyzing and Improving SaaS Experience
Digital Experience Monitoring (DXM) tools integrated into remote workforce dashboards provide valuable insights into employee SaaS experience scores per region. By analyzing these scores, organizations can identify regions experiencing suboptimal SaaS performance and take necessary measures to rectify issues, ensuring seamless productivity and collaboration. - Optimizing Wi-Fi Signal Quality
To address connectivity issues, remote workforce dashboards allow organizations to identify the top 10 users with poor Wi-Fi signal quality. By analyzing trends, network teams can optimize Wi-Fi access points to ensure that employees have a stable and reliable connection. This especially holds true for Microsoft Teams room users that may be overloading Wi-Fi capacity.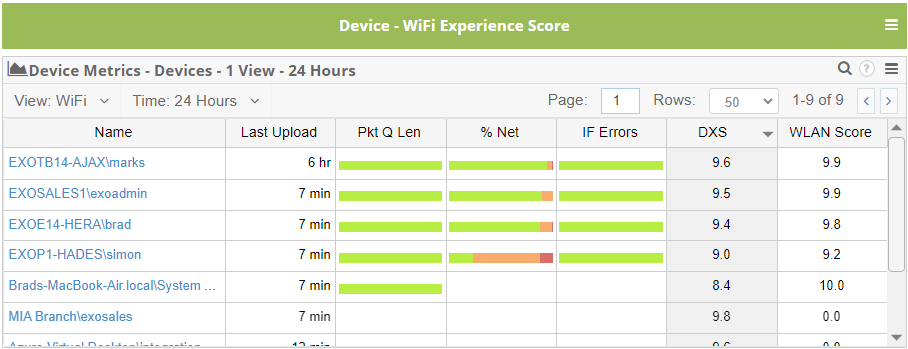
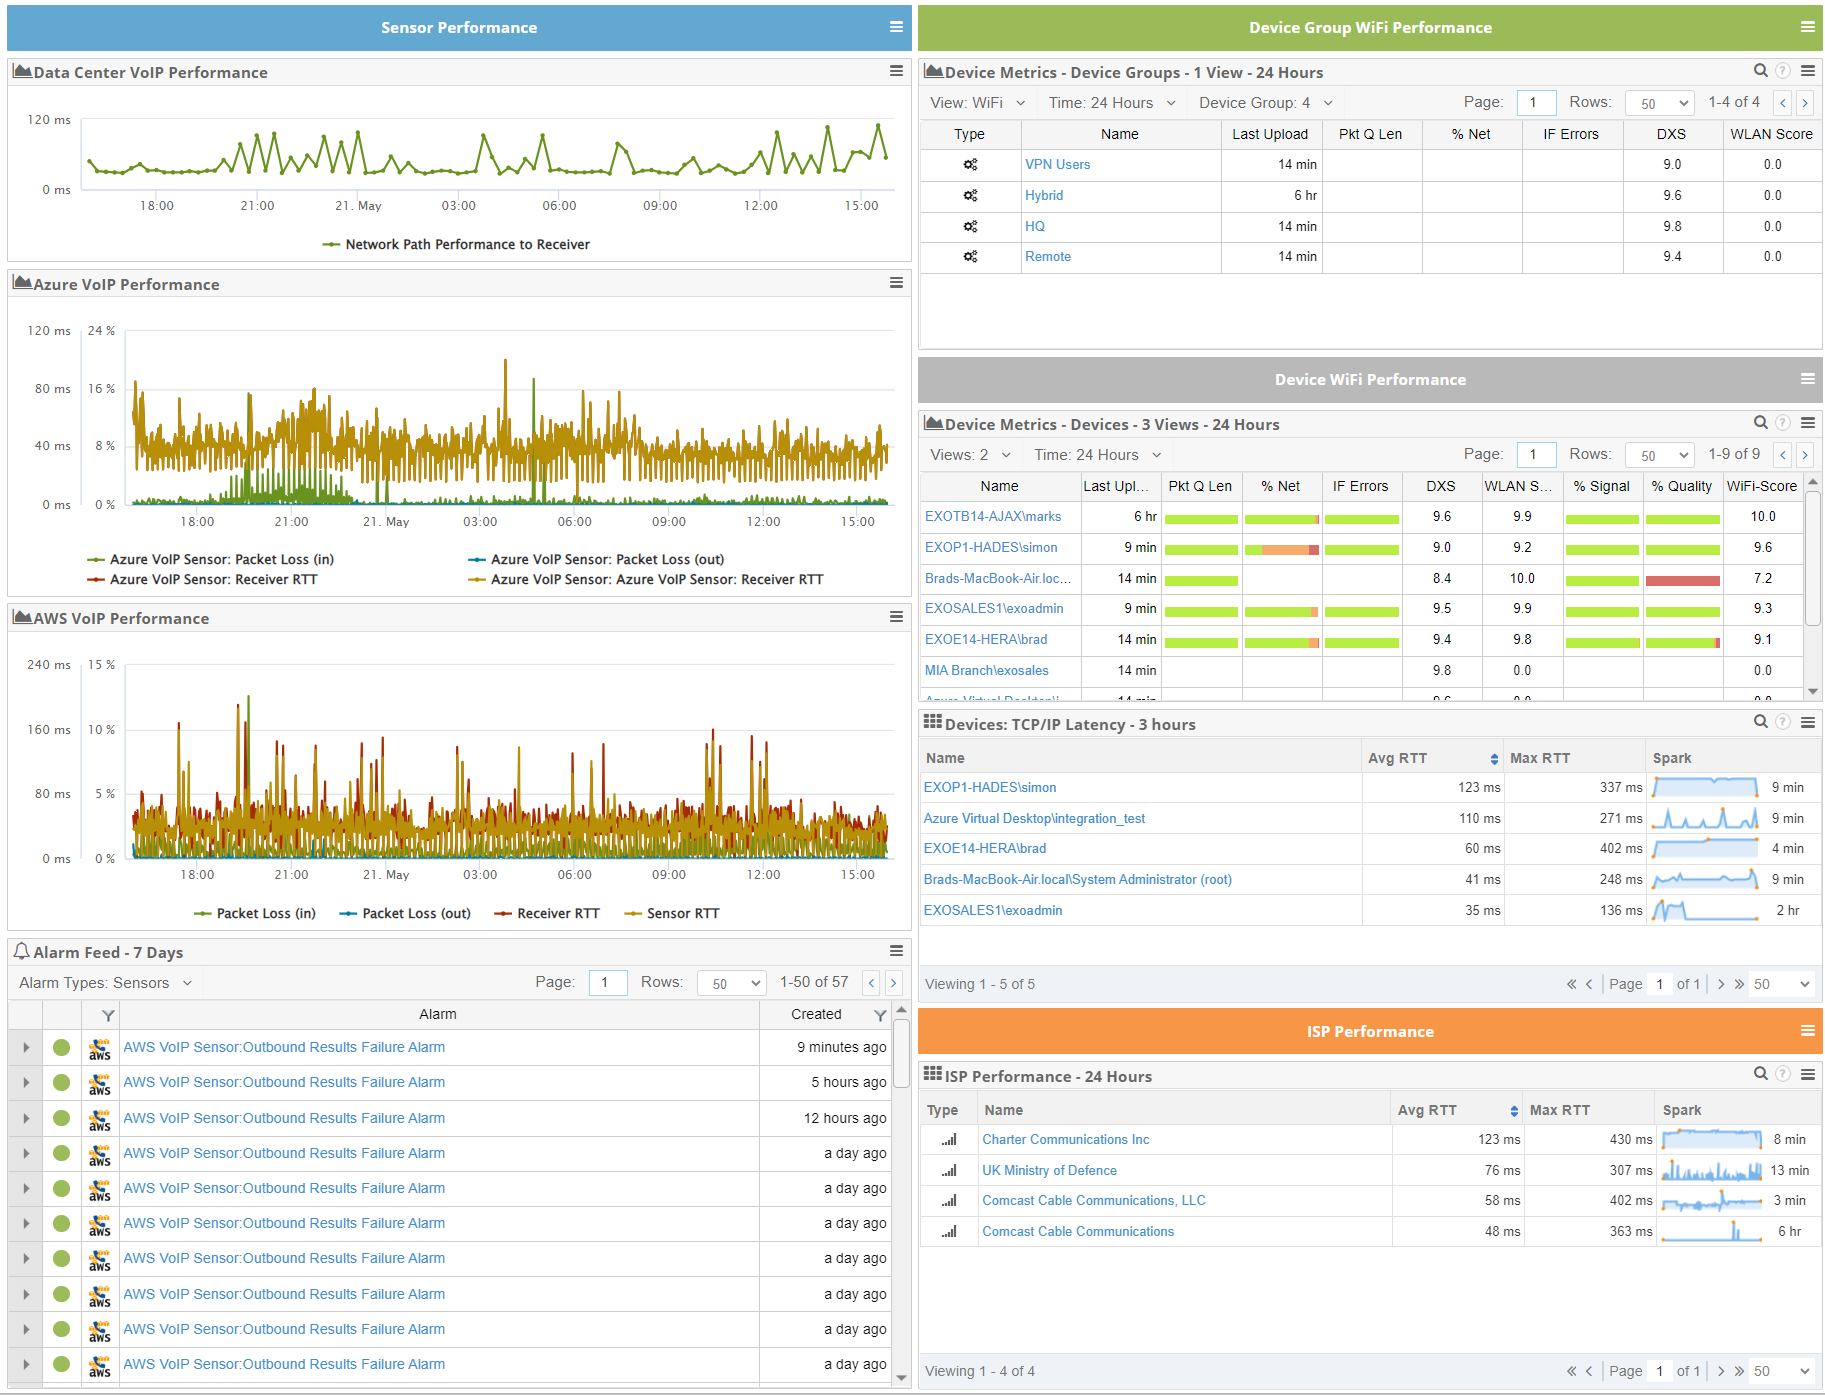
Device WiFi Performance 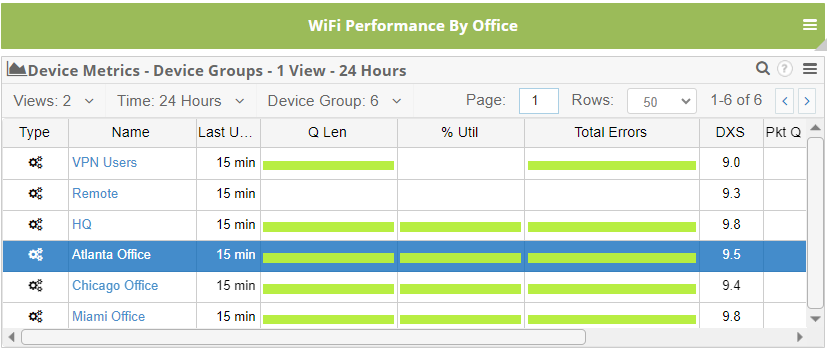
Wi-Fi Performance of Device Groups by Office - Application Performance Monitoring
Insight into the applications your users depend on for productivity is important for your remote workforce. Identifying the top 10 applications that consume the most resources lets IT administrators stay ahead of device refresh and PC upgrade issues. - Dashboards for Different IT Personas
Remote workforce dashboards can be tailored to meet the needs of different IT personas within organizations:- Network administrators benefit from detecting VPN or remote access issues and identifying bandwidth or reliability concerns with mission-critical on-premises apps.
- Helpdesk and support teams can integrate alarms from support vendors like ServiceNow and proactively identify and resolve user endpoint issues.
- Application owners gain insights into application outages and performance issues, facilitating prompt remediation and minimizing disruptions.
- CIOs and CFOs can use dashboards to recover lost SLA credits, assess overall SaaS performance and availability, and drive strategic decision-making.
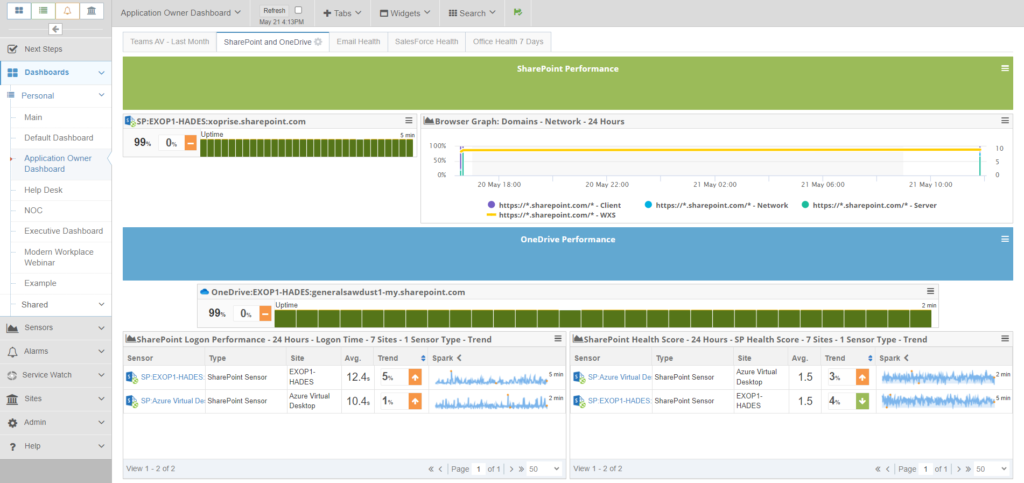
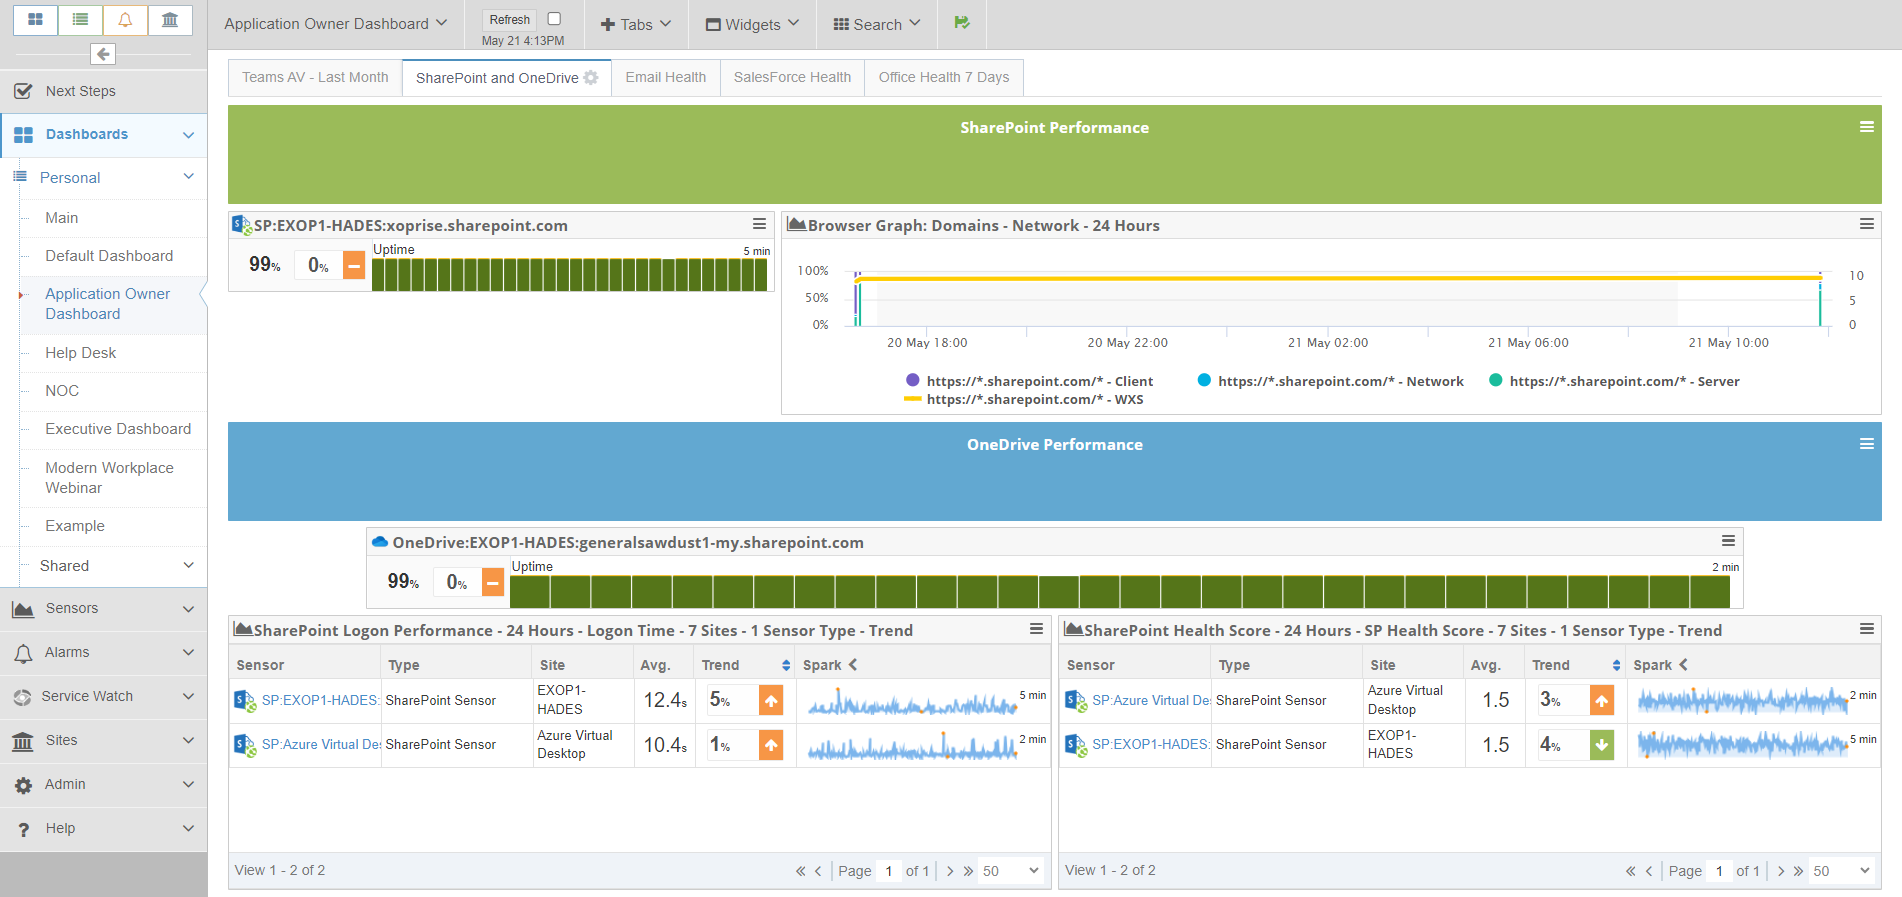
Dashboards for Application Owners 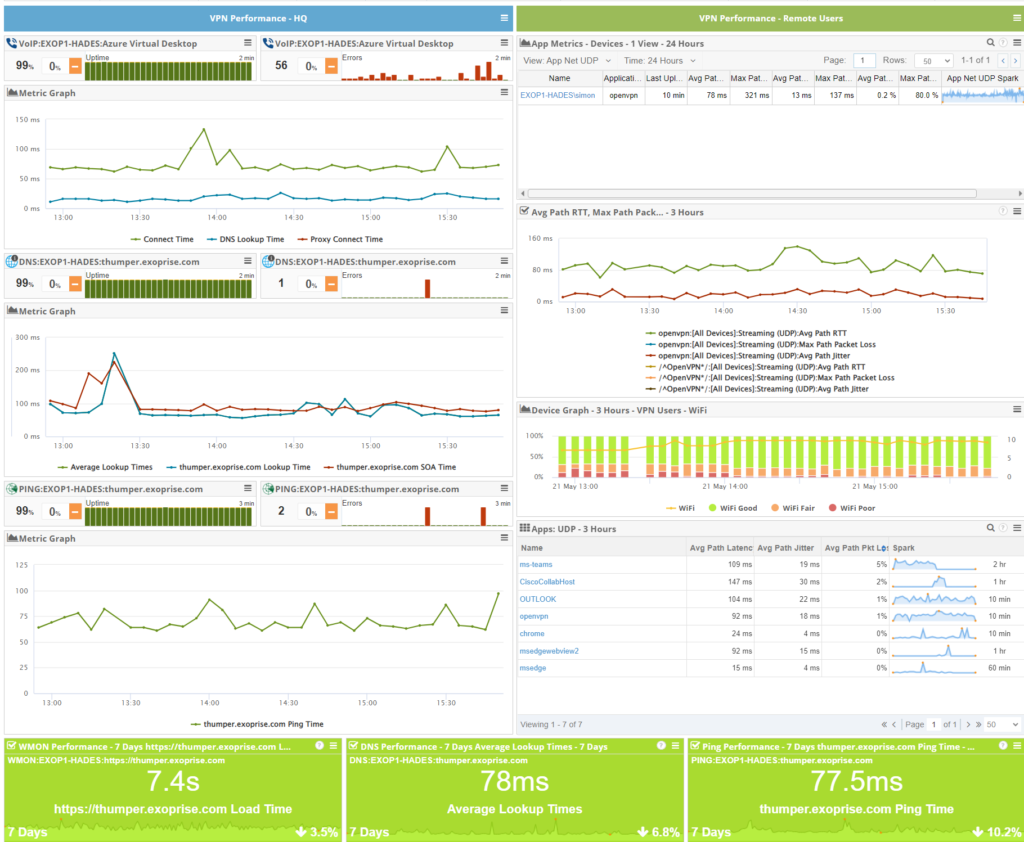
VPN Performance of Offices and Devices
- Geographical Insights
Considerations for Building Remote Workforce Dashboards
When creating dashboards, asking the correct questions is an important starting point to address common support issues. Here are some sample questions to help initiate dashboard construction:
- Are there applications like Outlook or Microsoft Teams that are causing user issues?
- Are there SaaS apps that operate slowly and would benefit from root-cause analysis?
- Are there devices of a certain type (laptops or desktops), or certain manufacturers, that cause more issues than others?
- Which Internet Service Providers (ISPs) are experiencing issues?
- Which specific users are encountering issues that require attention?
- What specific issues are users experiencing and what are the root causes?
- What is the employee Software as a Service (SaaS) experience score per region?
- Who are the users experiencing poor Wi-Fi signal quality?
- What are the slowest applications in each region or Organizational Unit (OU)?
Next, track the following parameters using Real User Monitoring (RUM) with Service Watch and Service Watch Active Testing. With the following metrics, developers and system administrators can gain valuable insights into the performance of remote workforce performance.
Begin developing a strategy from these questions and start building dashboards. Typically, Exoprise dashboards leverage some combination of CloudReady synthetics and Service Watch Real-User Monitoring (RUM):
- Typically, Microsoft 365 or SaaS synthetic test, health and performance. For example, if monitoring Exchange or SharePoint, you include the synthetic trends on the dashboard for a quick check as to the end-to-end health of the service.
- Alarm Feed: The alarm feed includes proactive synthetic alarms which can be filtered by region or service. Also, included, are Service Watch Desktop alarms for application and network latency.
- Live Experience Score by Domain: provides a real-time assessment of user experience on different SaaS domains affecting a remote workforce, quantifying the overall user satisfaction based on specified performance metrics.
- Live Response by Domain: tracks the response time of the server for each domain of the web application in real-time. Monitoring live response by domain helps in identifying performance bottlenecks and optimizing server-side processes.
- Device Experience Score (DXS): DXS is an overall measurement of the applications, system, and Network Digital Experience.
- CPU, Memory, System, and Stability Scores: the various scores are indexes into device and system health and aid in identifying system problems across the IT estate.
- Wi-FI, Gateway, TCP/IP and UDP Path Latency: Service Watch continuously monitors the application network latency for core applications. They can also be alarmed on.
- Connection Failures: Connection failures indicate instances where the user’s device is unable to establish a connection with the server. Monitoring and analyzing connection failures or server/SaaS errors helps in identifying network issues and ensuring high availability of the application.
Conclusion
In an era dominated by hybrid and remote work, effective digital experience monitoring has become essential. Remote workforce dashboards powered by RUM techniques offer organizations the ability to gain visibility into the performance of their dispersed workforce.
By analyzing key metrics, leveraging dashboards, and monitoring user experiences, organizations can improve productivity, address issues promptly, and maximize the value of their remote workforce. Remote workforce dashboards enable IT teams to proactively identify and resolve concerns, ensuring seamless connectivity, optimized application performance, and ultimately, satisfied and engaged employees.
Service Watch and Service Watch Active Test from Exoprise are key components to deploy to any remote workforce, providing data necessary for building dashboards used for easily tracking problems, whether widespread or user specific.
Related Posts


