With every webpage loaded, email sent, or video streamed, network traffic takes a complex journey…
CloudReady can easily monitor web pages and SaaS Applications from the end-user perspective. This article will demonstrate how easy it is to setup CloudReady for end-user perspective monitoring of any SaaS application or web page.
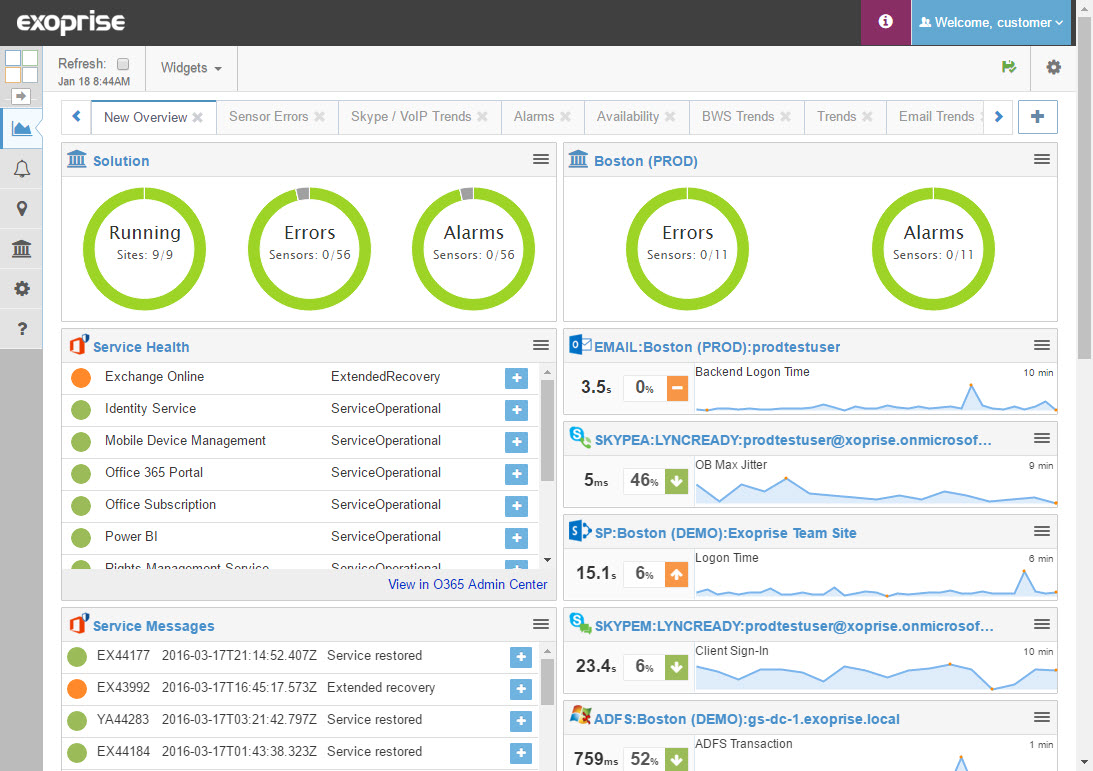
While Exoprise specializes in monitoring everything for enterprise SaaS apps like Office 365 and important business oriented services like Salesforce.com, you can also use CloudReady to monitor internally developed applications or custom SaaS services. And the monitoring can all roll up to the same dashboard. When these real-time stats for all of your SaaS services, internal apps, services, etc. come together in the same place, its trivial to build different dashboards for your CIO, Helpdesk, Network Team, Ops team and more.
A Few Clicks to Monitor Any Web or SaaS Application
This is easy to do. We’ll go through setting up a CloudReady Sensor for CloudReady itself (recursion!).
1. Setup a Private Site for Monitoring From Your End-Users Perspective
You want to monitor SaaS applications from your end-users perspective to know about end-to-end network, provider and authentication issues in real-time. To monitor from your own environments you first need to deploy a CloudReady Private Site. Read more about how easy we make it to deploy sites. We recommend putting our agent in similar networking conditions as your users will access the application from.
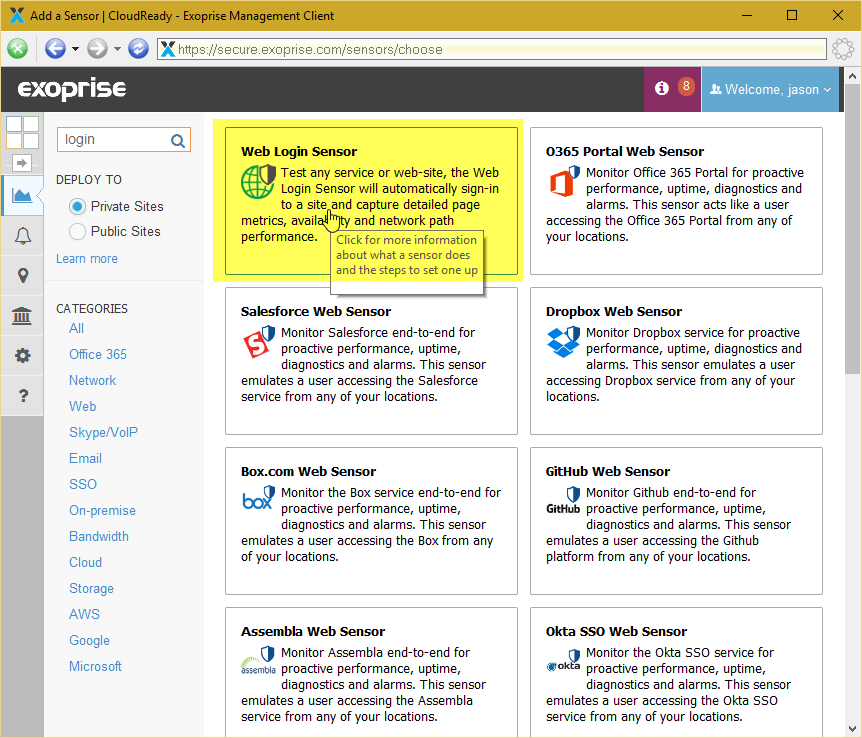
2. Next, Configure a Web Login Sensor
A Web Login Sensor can monitor any web site that takes credentials and has a login form. It also supports intermediate Single Sign-On (SAML) solutions like Active Directory Federation Services or Azure AD. A Web Login Sensor automatically detects authorization forms, fills them in and tests any URL or destination in the application.
Most web applications will redirect and return once the sensor is signed in. For example, you can specify that the sensor should navigate to a page within the application, the sensor will be redirected to sign-in and then, after sign-in, will be redirected back to the page that was requested. This can be very handy for testing deep within an application without having to resort to scripting.
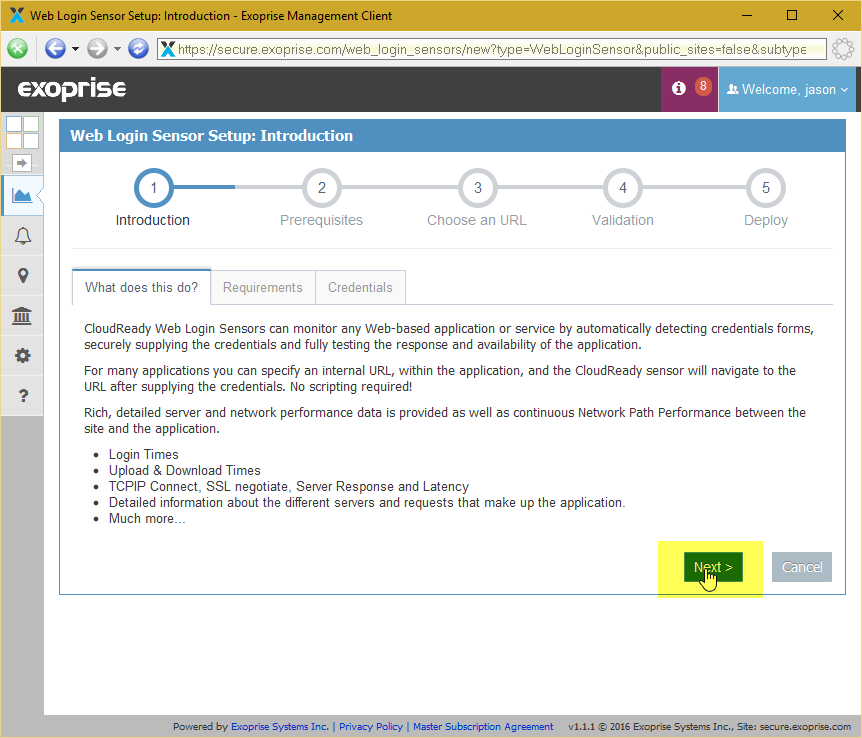
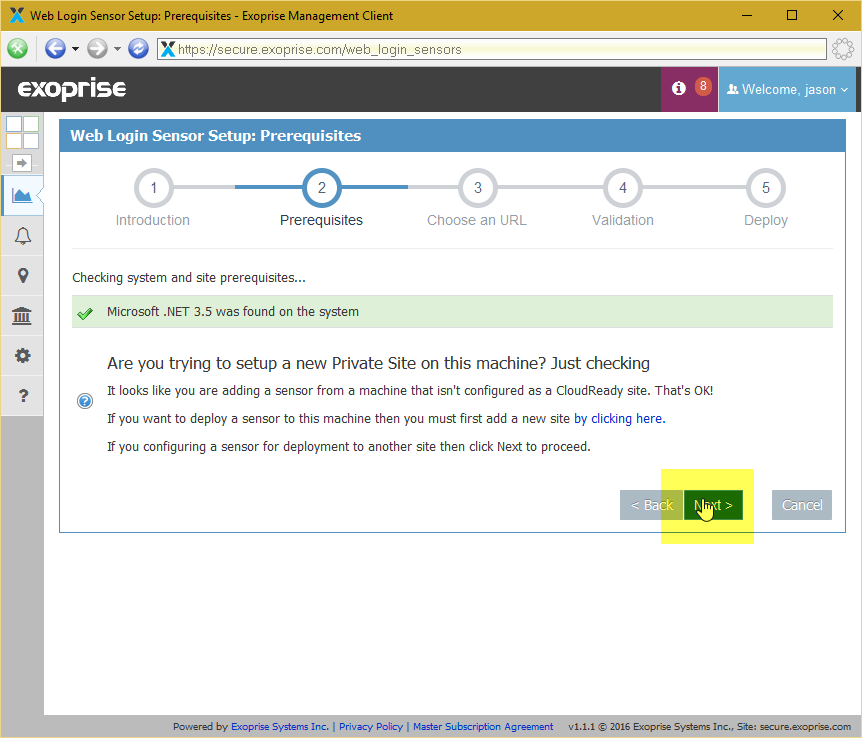
3. Click Next Through the Intro Steps
Each CloudReady Sensor has its own set of intro pages where you can learn more about what the sensor does. Click through this page and the pre-requisites pages. To have a peek, click and enlarge the following thumbnails.
[content type=page name=cta_trial status=private]
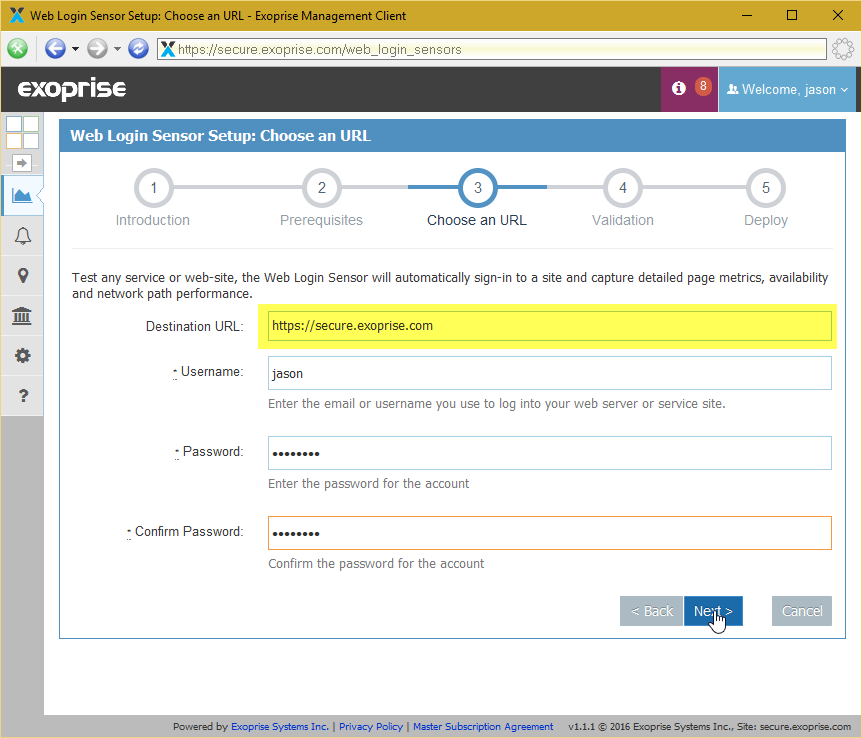
4. Next, Fill Out The Configuration Step For The Web Login Sensor
For the Web Login Sensor you provide an URL for the service or web application you would like to monitor. Again, the URL doesn’t need to be the login page but can be a page that is deep within the application and typically the application will require a login first.
Then, specify the identity of the person that you would like to login with, as well as the password. Once the sensor is created, these identity values are encrypted with the public/private key-pair of the CloudReady site that you deploy it to, ensuring that only the site(s) that you’ve assigned the sensor to can decrypt the sensor configuration. Each sensor configuration is protected by multiple levels of encryption and security (SSL, HMAC, PKI and more).
If you just want to test the availability of a web page without signing in or supplying credentials then you can choose a Web Monitor Sensor. A Web Monitor sensor can test any web page and collect performance and uptime statistics about the application. You can also try CloudReady WGET Sensors which perform HTTP GET transactions against up to 5 URLs for faster timing information.
5. Press Next for Validation
When deploying sensors to private sites, CloudReady will validate the sensor configuration and operation before deploying. Nobody wants to deploy a sensor to 20 sites and then have them all start generating errors. Here’s what a validation step looks like:
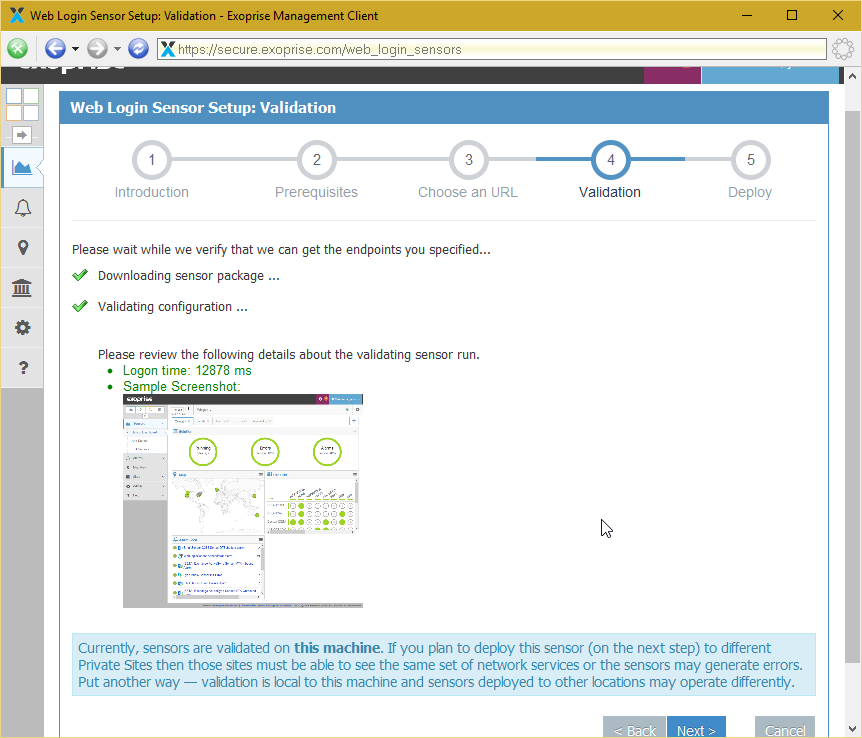
Notice that for a Web Login sensor you are presented with a screenshot of what the sensor saw after signing in. This helps you determine if you’ve configured the sensor correctly or are seeing an error on the page when the sensor executes. You can right-click and open the image in a separate window to enlarge it.
6. Next, Deploy Your Sensor to As Many Sites as You Have
On this final step there are a few configuration options:
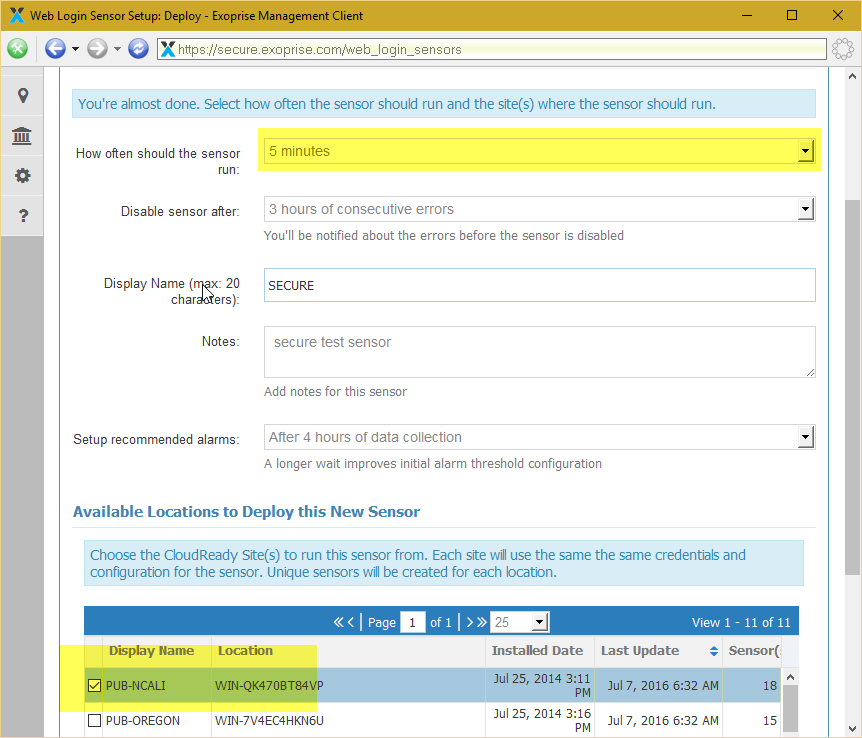
- How often the sensor should run
Each of the CloudReady sensors can run at different frequencies – configure the interval here. - Disable sensor after consecutive hours of errors
Sometimes configurations change and sites go away so if the sensor generates hours of consecutive errors CloudReady will disable the sensor. - Display name
You can give the sensor a display name that will be part of the sensor title. Sensor titles are composed of an abbreviation of the sensor type followed by the site name (or site display name) followed by some sensor specific part of the configuration. - Setup recommended alarms after how many hours of calibration
CloudReady will automatically setup the most important alarms for each sensor as you deploy them. CloudReady examines the metrics that are collected for each sensor before configuring the alarm – we call this a calibration period. The longer you wait the better the calibration. - Finally, select the sites where you would like the sensor deployed
Once a sensor is configured and validated you can deploy it to as many sites as you have permission to.
The Results: Monitor Any Web Application or SaaS Property From the End-users Perspective – No Scripting Required
Here’s an example of a Web Login Sensor for CloudReady itself. Let’s go through some of the metrics that are captured. Click on the following thumbnail to have a look:
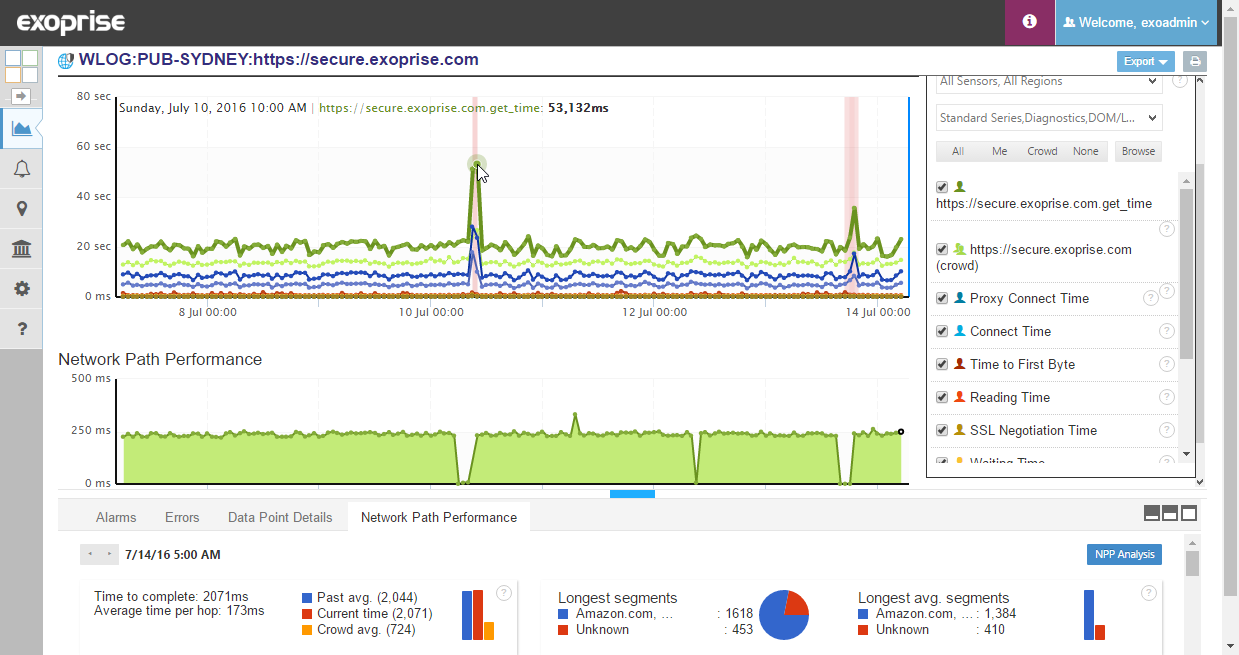
- Overall Load Time for the destination page including time to login
A core metric for our Web Login Sensor is the load time or get time for the destination page of the SaaS application or Web Page. This will include the redirects to the authorization page and any possible SAML or Single Sign-On pages in-between. - Crowd-based comparisons of the Load Time across other sensors
This is another critical feature of CloudReady – our crowd-powered monitoring. Here you can see the comparison of Load times between Sydney Australia and other sensors for the same site that are located in different parts of the world. This crowd metric can be filtered regionally and by your own sensors. - Document Object Model (DOM) and Navigation Timing statistics across pages
DOM and Navigation timing events such as Connect time, SSL Negotiate, DNS Lookup are collected and aggregated for each of the steps that our sensors perform. You can click through to see any of these metrics collected on a server-by-server basis going as far back as 90 days. These metrics can be crucial for diagnosing whether the slow-down is due to network, provider, server or LAN conditions. - Network Path Performance (NPP) between the sensor and the cloud app
CloudReady sensors automatically capture hop-by-hop level data between where the sensor is located and the datacenter routers that the sensor connects to – for each transaction. This can be helpful to determine if network issues and where in the network path slowdowns are occurring. NPP metrics are captured for each run of the sensor and aggregated for up to 90 days of historical data. Crowd-based comparisons of NPP data are also available for a unique perspective into the network health of the Internet.
Here’s a sample outage and availability report for the same sensor:
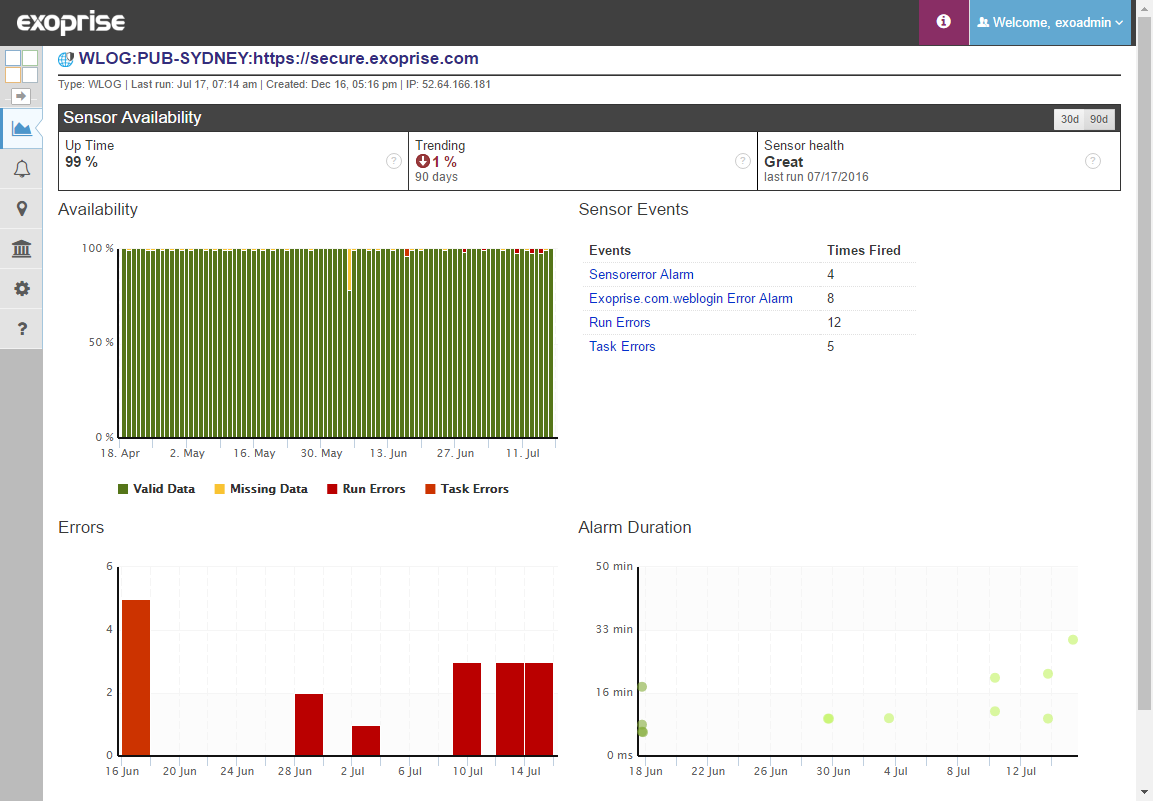
Now you can see how easy it is to setup and capture the end-to-end uptime, SLA and performance for any Web or SaaS application. Give it a try yourself and start getting your organization CloudReady.
Related Posts


