With every webpage loaded, email sent, or video streamed, network traffic takes a complex journey…
Introduction to Remote Desktop Services
This article describes the new CloudReady RDP Sensor that can be used to monitor Remote Desktop Services (formerly known as Terminal Services), Remote Desktops, RDP Performance and even Citrix XenApp. Frequently, we have customers that use CloudReady to monitor Office 365 within Remote Desktop Services (RDS) environments. Often, applications like Office 365 and Outlook are delivered via RDS or XenApp environments for security and control. And our customers have asked for the ability to monitor Remote Desktop Services and perform load-testing for RDS.
Now with the release of our new CloudReady RDP Sensor, customers can proactively monitor Microsoft Remote Desktop Services and Citrix XenApp environments with the same ease as they monitor their cloud services. Now you can monitor RDS performance alongside all of your cloud/SaaS apps, inside-out, outside-in all from the same single-pane-of-glass.
New CloudReady RDP Sensor
In a nutshell, the CloudReady RDP sensor signs into remote sessions, optionally through a Remote Desktop Gateway (RD Gateway), and automates the launch of an application just how a user would. The RDP Sensor can do this once every 5 minutes from locations behind the firewall or out in the cloud.
Along with exercising the RDP services and stack, the sensor captures the timings and availability of how long the different operations take. Additionally, most of the metrics are crowd-sourced like the rest of the CloudReady Sensors so that you can see how your RDS, Terminal Services or XenApp compares to other Exoprise Customer’s environments. This is crucial to load-testing, base-lining and overall performance tuning.

The RDP sensor automates the Remote Desktop Client control and uses OCR technology to read the session screen. Screen reading eliminates the need for server/RDP extensions and emulates a user seeing the screen results. No server side alterations are required for the CloudReady RDP sensor. Currently, the sensor supports a single interaction once connected to a session – you can specify a command line to launch an application and then provide text to search for within the application. This enables you to measure how long it takes to login to a remote RDP session, start an application and wait for the app to start and present its interface – as long as the text is present within the interface. Read on for more setup details.
Slow Remote Sessions? Lousy Application Startup? Not Enough Bandwidth for Remote Desktop Protocol?
Some customers deliver their entire end-user application tier via Remote Desktop Services and don’t have any insight or ability to monitor Remote Desktop Server performance from the end-user perspective. Whether you use Remote Desktop for mobile access, branch offices, remote contractors, or just centralized application control you need to understand how the Remote Desktop Protocol performs in your environment as well as how your Remote Desktop Servers are performing for application launch.
With the CloudReady RDP Sensor you can now continuously measure for performance and availability of your Remote Desktop infrastructure end-to-end. The following metrics are captured, analyzed, trended, and crowd-sourced. The metrics are stored for 90 days.
- Total Login Time
Time it takes for the sensor to initialize, connect and login into a remote session - Connect Time
Time it takes to connect to the Remote Desktop Server - Login Time
Time it takes from being connected to the Remote Desktop Server to full login to the remote session - Bandwidth
Bandwidth as measured and reported by the Remote Desktop Client session. Bandwidth directly affects the quality and responsiveness of the RDP remote session - RTT
Round-Trip-Time as measured by the Remote Desktop client during the session. Latency directly affects the qualify of the Remote Desktop connection session - Quality
Quality of the RDP connection as measured by the Remote Desktop Client. Quality is reported as a number between 1 and 4 with 1 being a poor connection and 4 being a good connection. Bandwidth and latency (RTT) will influence the quality of the RDP session. - Program Launch
This is the time it takes launch the program after inputting the configured command-line and recognizing the input text. If you are interested in how long it takes for an end-user to launch an application in a remote desktop as part of a Service Level Agreement (SLA) then this value can be helpful. - Login to Launch
This is the total from login to the desktop (where the desktop/menu/taskbar is presented) to recognizing that the configured program is launched and running. - Logoff Time
Logoff time is the time it takes to logoff of the remote RDP session. The CloudReady RDP Sensor logs off each remote session that it has to reset the session.
By default the most critical elements are automatically configured to alert you when there is a problem. You are also notified if any of the steps fail or produce an error.
What’s it Take to Get Started?
Here are the steps to setup a CloudReady RDP Sensor:
1. Setup a Private Site for Monitoring From Your End-Users Perspective
You want to monitor RDP performance from your end-users perspective to understand end-to-end network, bandwidth, latency and quality issues in real-time. Read more about how easy we make it to deploy sites. We recommend putting our agent in similar networking conditions as your users will access the application from.
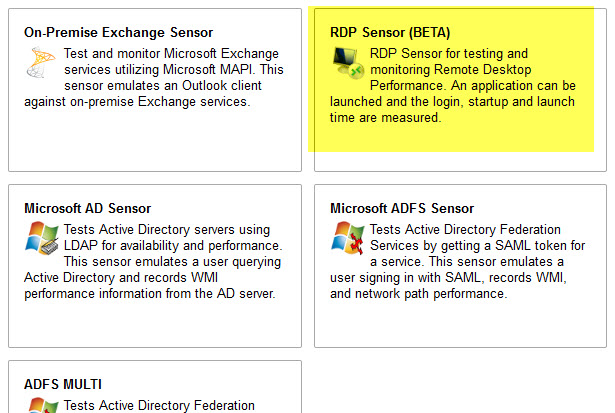
2. Next, Configure an RDP Sensor to Monitor Remote Desktop
An RDP sensor creates a remote session against any Remote Desktop Server farm, VDI instance or Virtual Machine as a valid user account. The user can be local to the server or be a member within the domain. Exoprise recommends creating dedicated accounts for the RDP sensors within the farm as each sensor will login and logoff from their session for each sensor run.
In a load-testing scenario you can utilize PowerShell to create accounts within the Remote Desktop Environment at the same time as you allocate and deploy CloudReady RDP sensor(s). See more about our PowerShell Management API and how it can be utilized to automate sensor creation. This is helpful if you plan on spinning up dozens of sensors at the same time for load-testing your Remote Desktop Services.
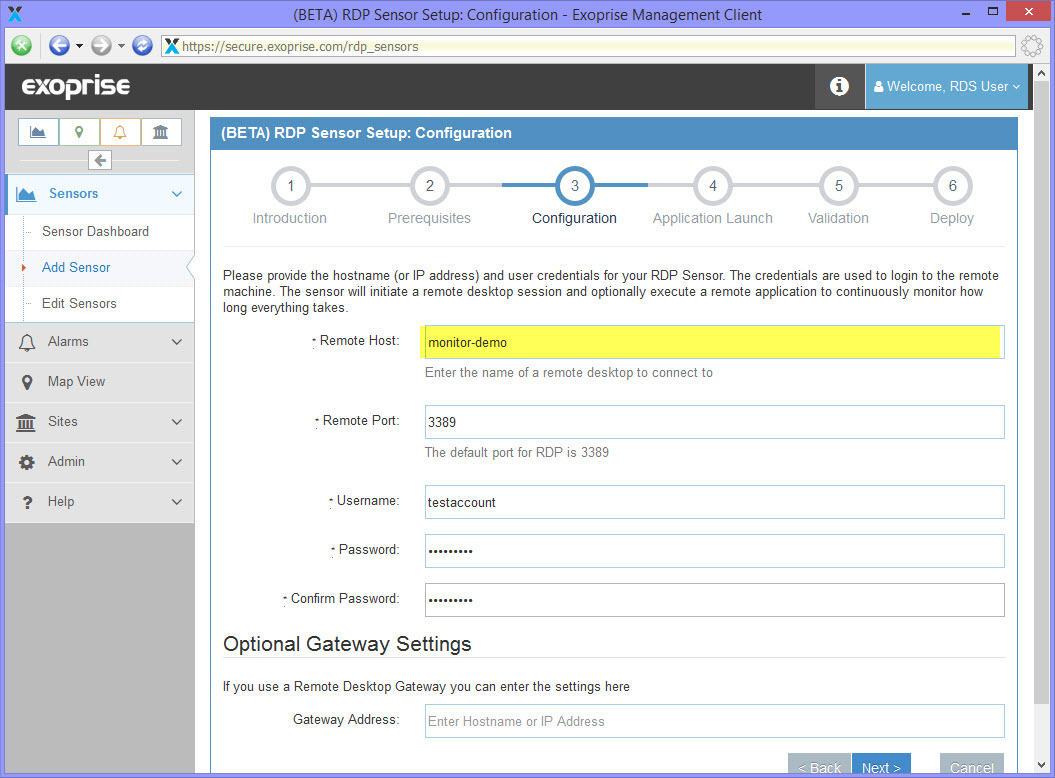
3. Enter the Login Credentials
Enter the login credentials for the account that you just created. For testing, you can enter your own account to see what it does. All supplied information will be validated and tested before the sensor is deployed.
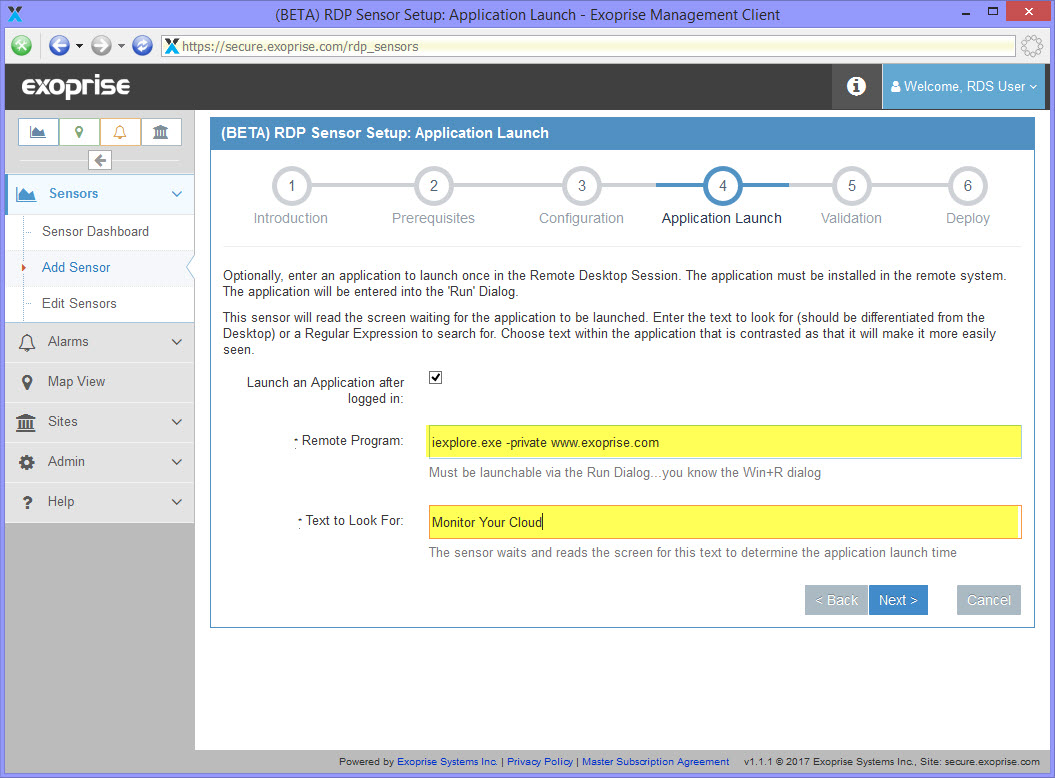
4. Next, Enter the Application That You Want to Launch
Optionally, you can have the RDP sensor launch an application once its signed into the remote session. This can be used to test how long it takes from login to launch of an application. We have customers using this for load-testing their XenApp and Remote Desktop Server farms and for disaster recovery scenarios. By continuously testing the launch time of any application, customers can be certain they are always prepared to deliver mission-critical applications via remote desktop, VDI or Terminal Services.
In this example, we are launching Internet Explorer in the Remote Desktop session and having it navigate to www.exoprise.com. We are going to have it look for the text that we know is on the front page of our site, “Monitor Your Cloud”. When the sensor reads the screen and sees this text, it will know the application has finished launching. You can supply any path to a custom application and have it search for text in the title-bar or within the application.
5. Next, Validate the Session and Application Launch
Before you can deploy a sensor to a Private Site you must validate its configuration. Once you click next, the sensor will be tested with the current configuration. For the RDP sensor this can take a few minutes while the sensor is downloaded, the session is launched and tested. The cool thing about the RDP sensor is that it captures screenshots of the RDP session during validation and presents them when it is finished.
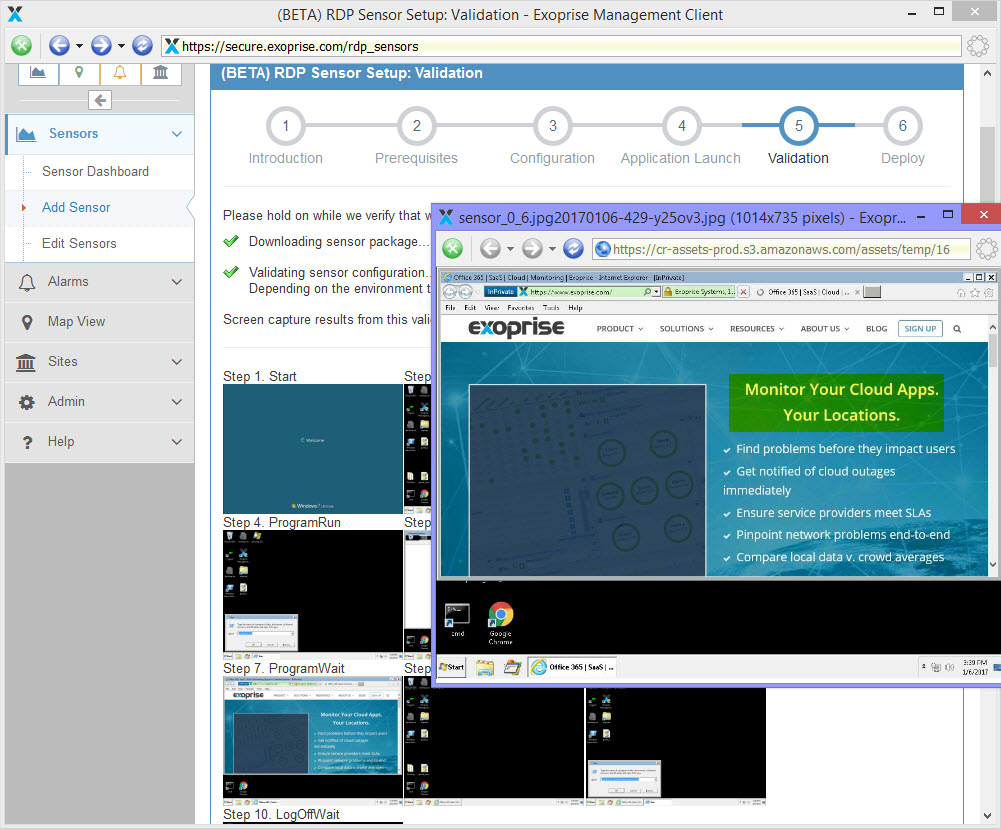
By capturing the screenshots you can see if the correct application is being launched and that the condition for successful launch is being met. Unless the application launch is successfully detected, you won’t be able to continue with the deployment of the RDP sensor.
Continuous End-to-end Monitoring and Testing of Your Remote Desktop Environment
Once you deploy your sensor you will be continuously monitoring the delivery of your application within your Remote Desktop environment! This can be used for end-to-end monitoring of your Remote Desktop Server, Citrix Xenapp or older Terminal Services environment.
Here’s an example of the visualization of our RDP sensor monitoring Remote Desktop Services.
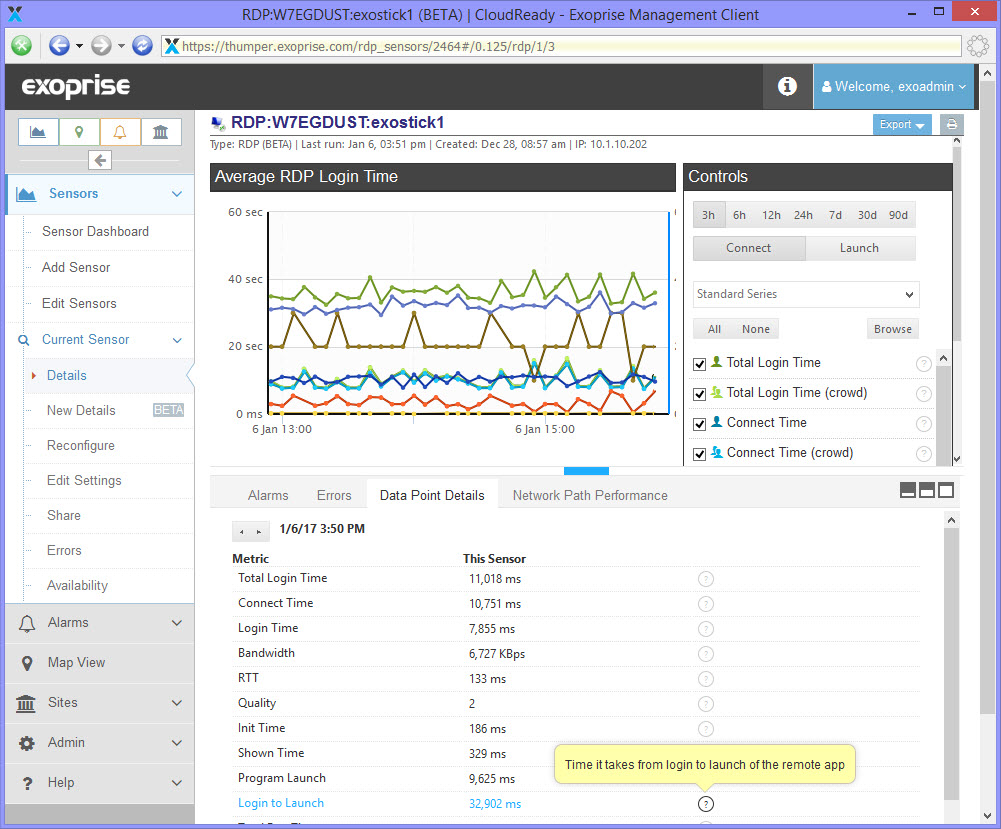
Proactively monitoring the performance, up-time and availability of your end-to-end remote desktop or VDI infrastructure is critical to successfully delivering Remote Desktop Services. With CloudReady you get the additional benefit of being able to compare your private-cloud desktop performance to other customers, anonymously and in aggregate, to gauge just how great your own setup is performing. Give it a try.
Related Posts


