With every webpage loaded, email sent, or video streamed, network traffic takes a complex journey…
Introducing Exoprise Service Watch™
Exoprise has long dedicated itself to excellence when it comes to synthetic (active) monitoring for cloud services like Office 365. But sometimes customers want to monitor an application that we might not support, a custom in-house application, or they want to get the perspective of an end-user that is on the road or telecommuting. That’s where our new Service Watch can come in handy.
Real User Monitoring for Third-party SaaS & Cloud Apps
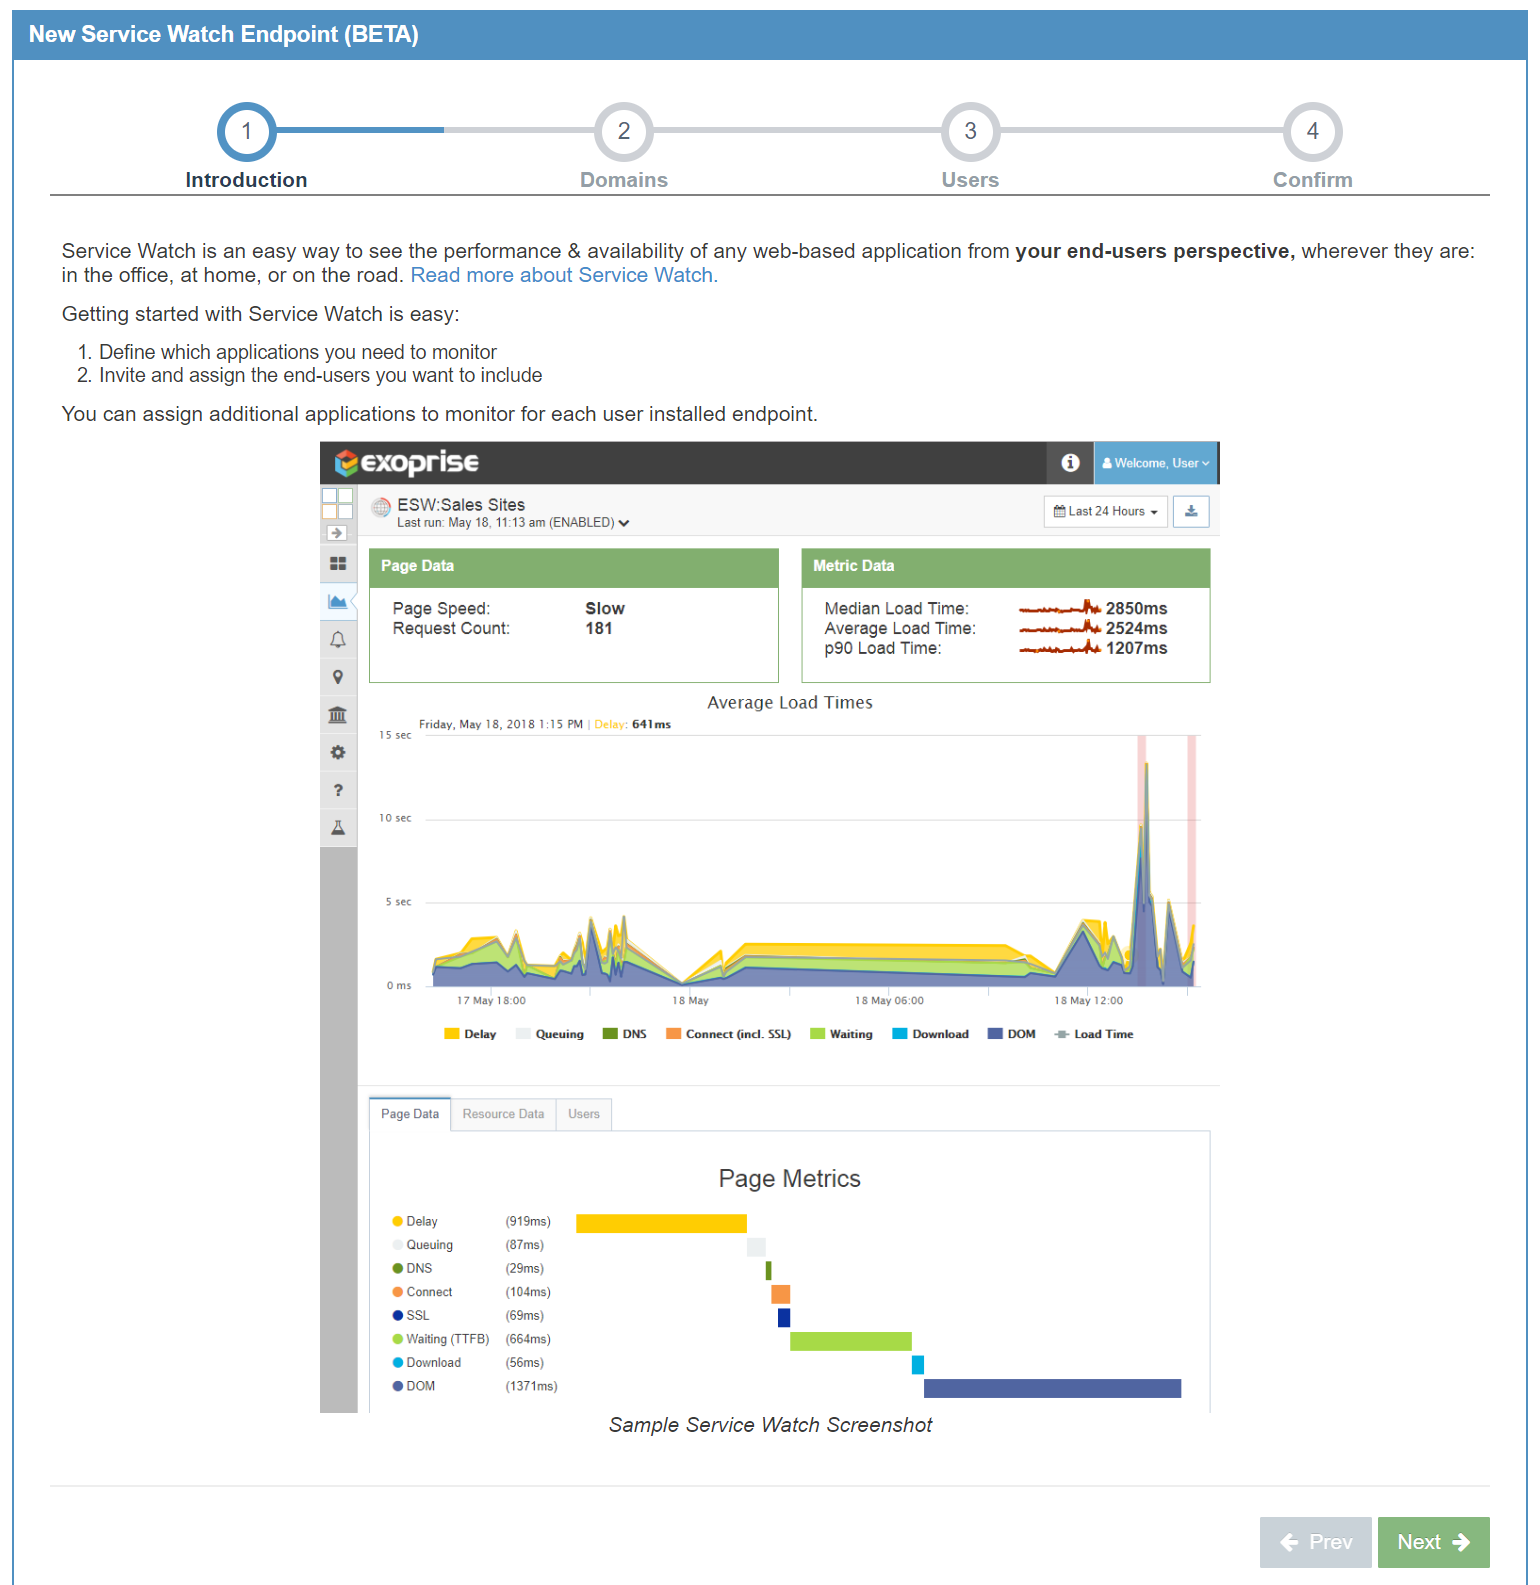
Service Watch is a form of real user monitoring (RUM) that uses an extension to plug into an end-user’s browser. Once the extension is installed, Service Watch administrators configure it to collect data on whatever URLs and traffic they would like to monitor and see real browsing metrics, errors, most commonly viewed pages and other performance timings. All of Exoprise’s products focus on giving you a clear, single-pane view of your services from where your user’s actually access them, user work-stations, and Service Watch is no different.
RUM for Office 365
Exoprise Service Watch is ideally suited for:
- Telecommuters and traveling personnel who are experiencing problems but are outside of your network
- Any end-user having difficulties with performance over a WiFi, VPN, MPLS or other connection
- Machines where you might not be able to install a CloudReady Private Site for setting up active monitoring sensors
- Locations that may be experiencing an intermittent problem
Service Watch can be installed for any user with a supported browser; enabled, disabled, and adjusted instantly and as often as needed. Setup is quick and easy, and the extension can be self-service installed by anyone with an invite. Users don’t need to become a member of the CloudReady tenant or organization, they don’t need to understand CloudReady to get the benefit.
Setting up Exoprise Service Watch
To start monitoring with Exoprise Service Watch, just send send an email invite to install the extension, have them flip it on, configure the domains and apps that you want to report on and you’ll have first hand data on network and app issues in minutes. We also recommend trying it yourself so you can understand the experience.
Setup Steps in More Detail
- Sign into CloudReady and from the left-hand menu, go to Service Watch > Setup
- Click next to begin
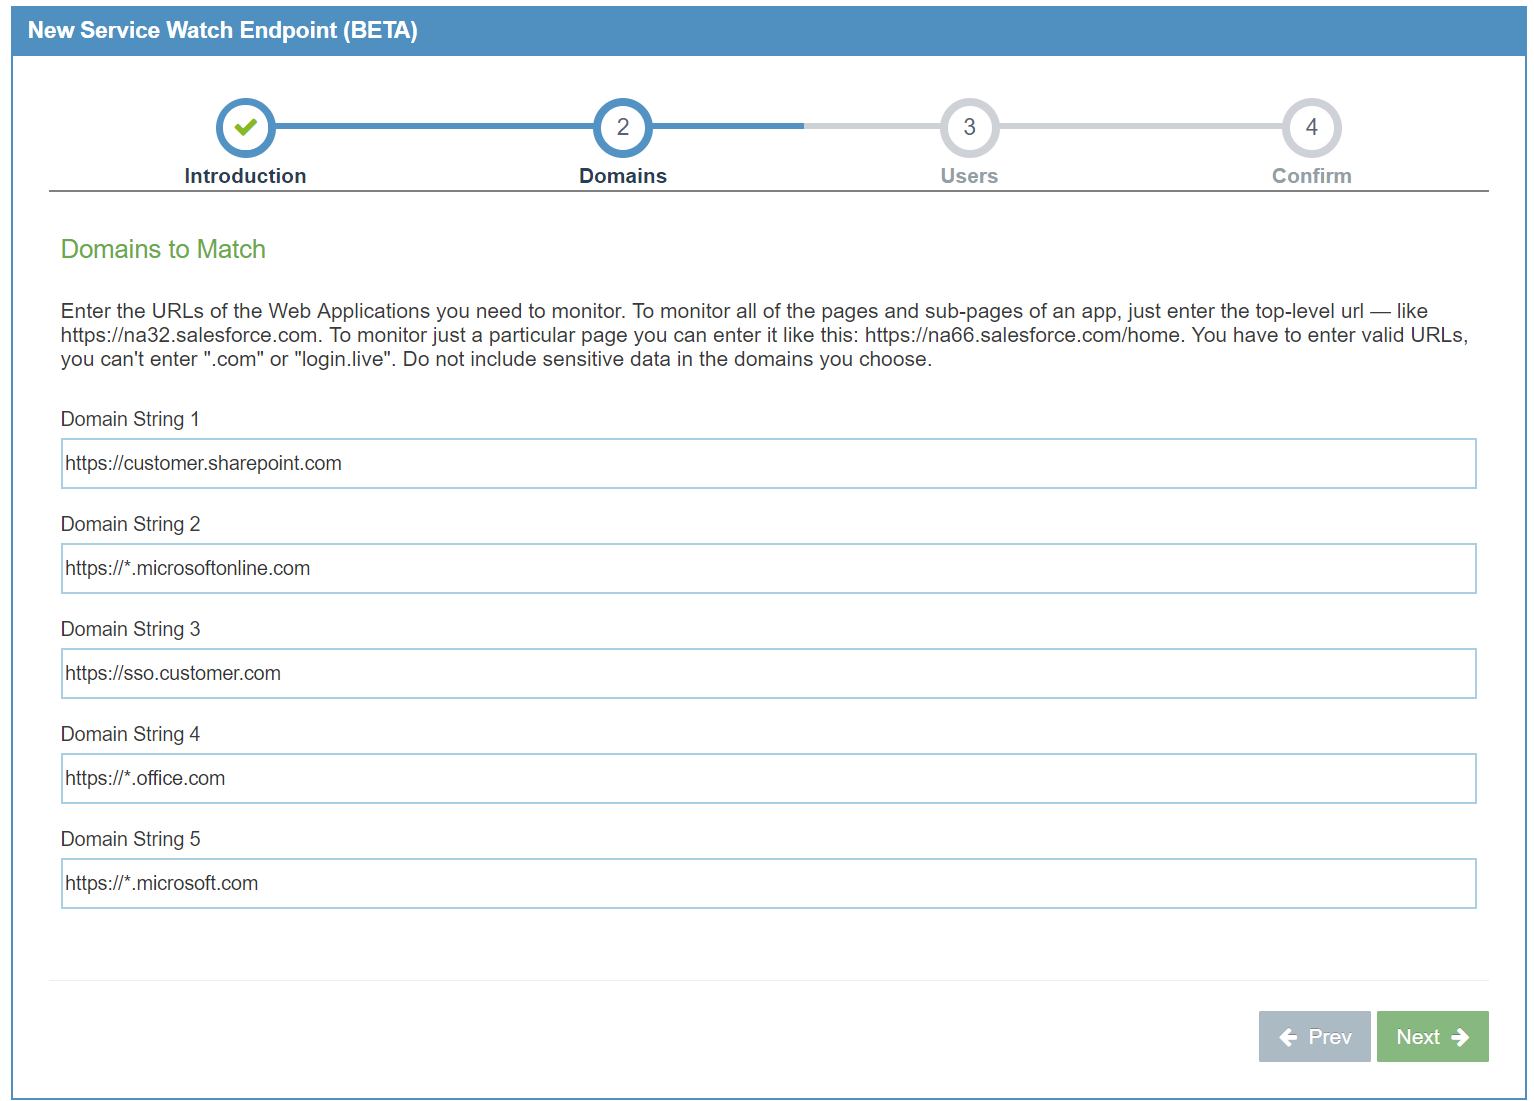
3. Configure URLs and domain filter patterns to monitor. A single extension install by a user can support multiple URL sets.
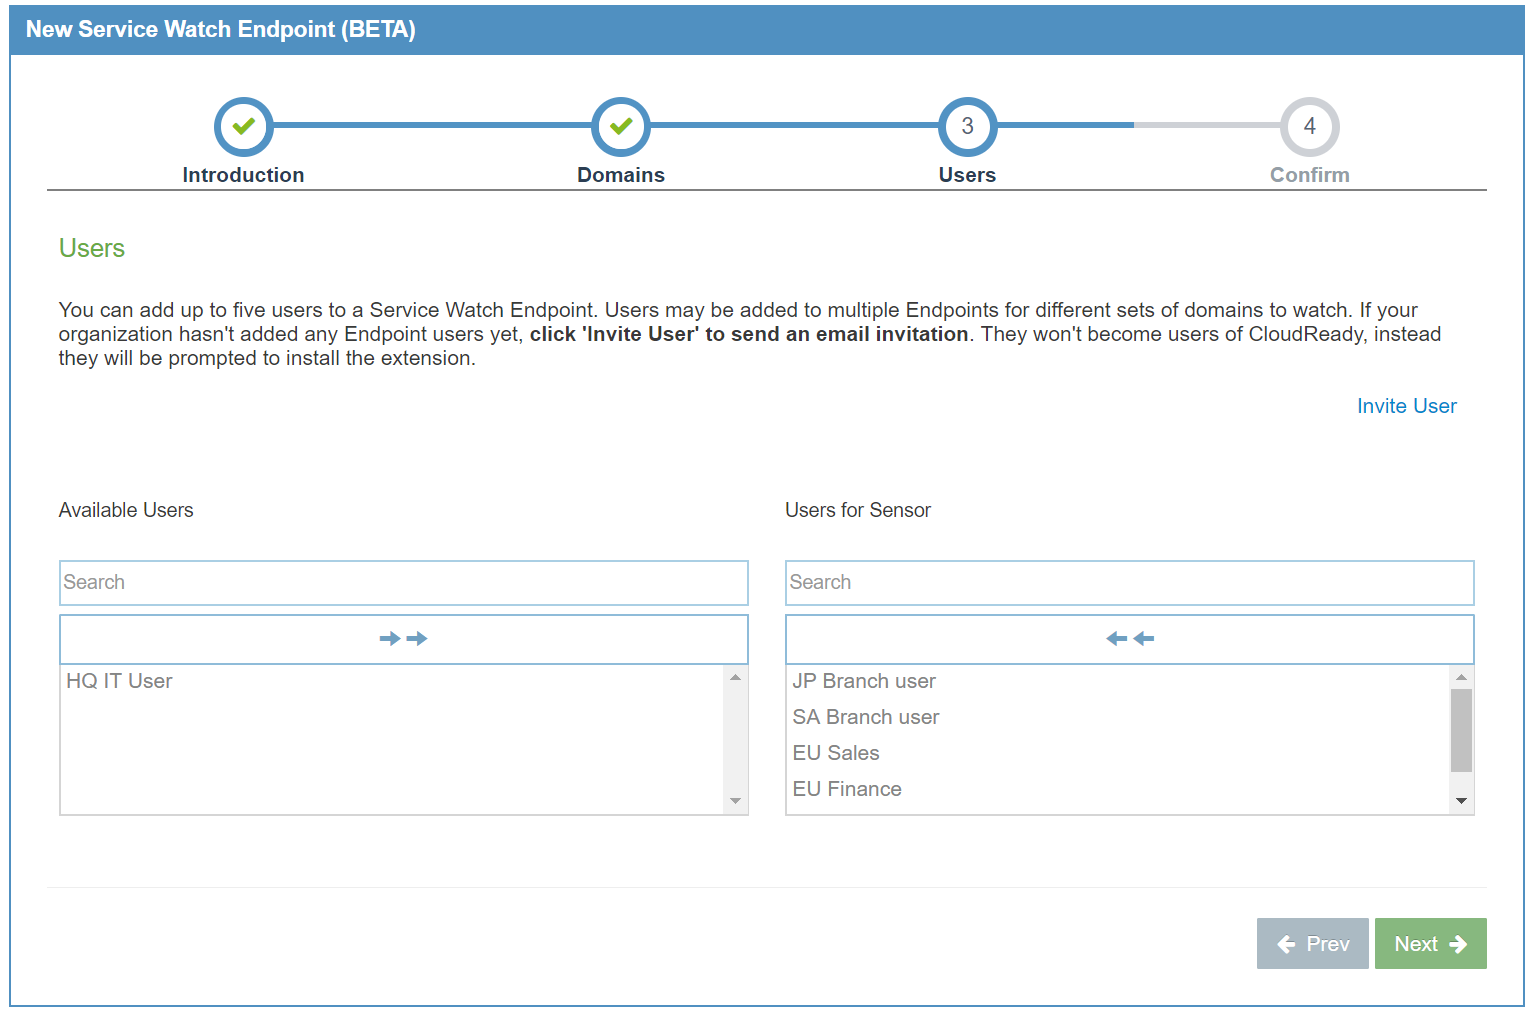
4. Add users that already have Service Watch installed or invite new users. Depending on the users browser configuration, all of their browsers will get the extension or they can install multiple times for each device.
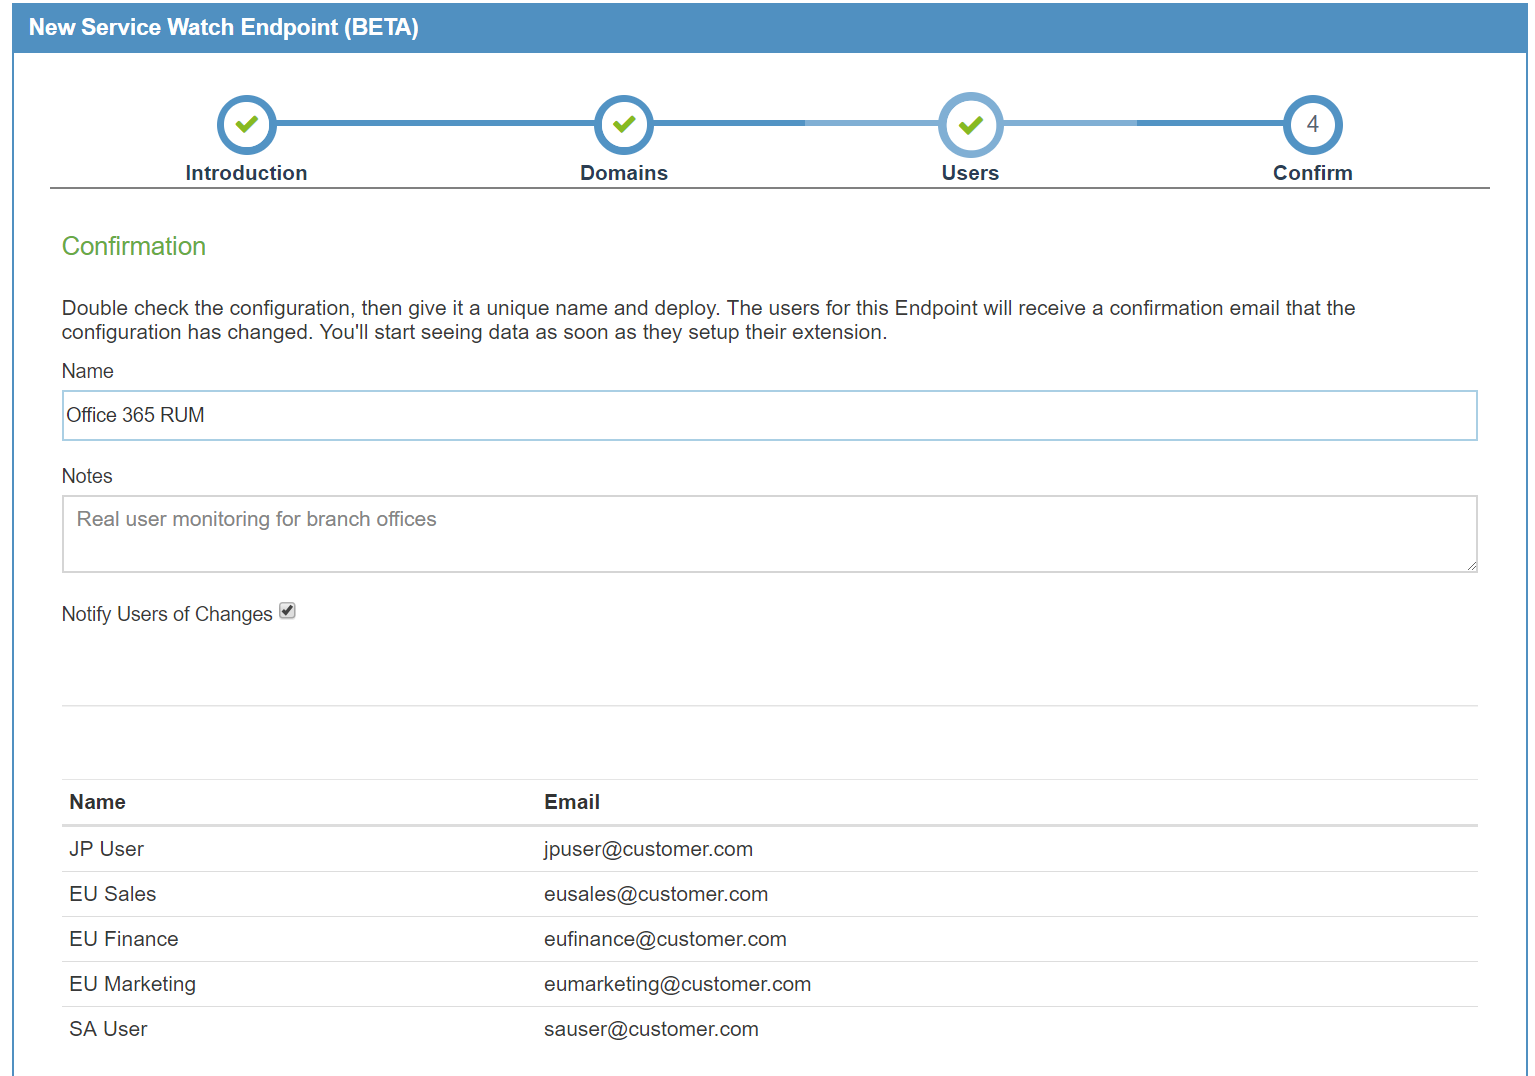
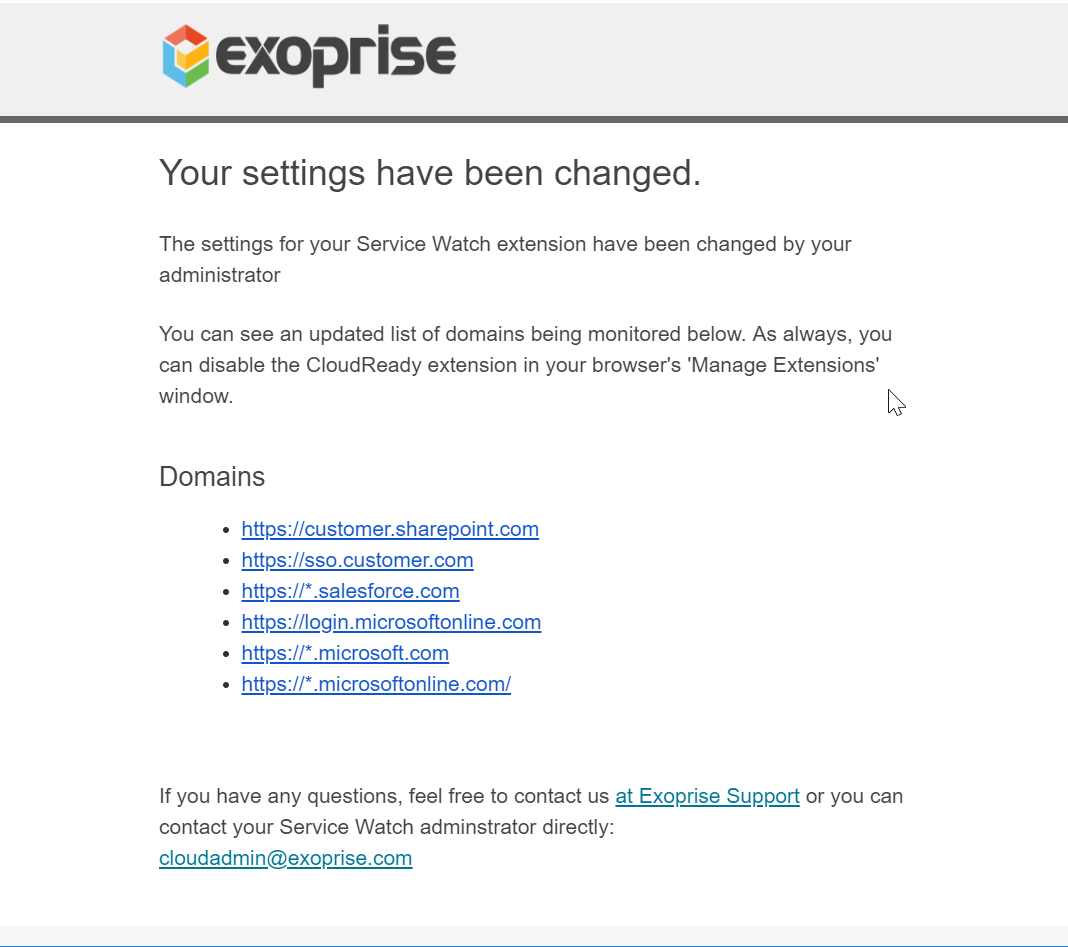
5. Finalize the configuration. Optionally, and by default, Service Watch users are notified of the URLs that you are monitoring on their behalf. If selected, they will get an email that the URL filters have been changed.
What users see in an email when they are notified of of the URLs changing for Exoprise Service Watch.
Real User Monitoring for Office 365
Customers use Exoprise Service Watch to monitor mission-critical applications like ALL of Office 365. See the previous section for a set of URLs including SharePoint, Single Sign-on and Microsoft Azure AD facilities. Different URL patterns can be configured to support:
- Outlook Web Access, SharePoint, OneDrive and everything in between
- Real user monitoring for all of Salesforce, App Exchange, Lightning, and custom apps within Salesforce
- Microsoft Dynamics whether its hosted on-premise, a partner, or integrated with Office 365
- Any custom web application, even if its not supported by our existing CloudReady sensors
Real User Monitoring Overview
Real User Monitoring (RUM) or end-user experience monitoring (EUEM) provides insight into how actual users interact with a web application. Real user monitoring with Service Watch captures session performance while the user is interacting with a website through their browser. Service Watch delivers accurate, real-time performance information for the end-user session, network performance and, most importantly the performance of the cloud application as they are using it.
No Inspection or Server Changes Required
Service Watch RUM doesn’t require SSL inspection or man-in-the-middling and can be used by anyone, anywhere with a supported browser. Service Watch is perfect for applications that IT doesn’t control where javascript injection can’t be performed and there is no control over the servers.
Service Watch can also be configured to support multiple domains and apps for the same end-user so that you can see the performance affects of multiple apps at the same time. For example, understanding the affects of different proxies, their branch-office environments, SD-WAN or different network conditions is easily accomplished with Exoprise Service Watch. Triage those tricky, intermittent network issues that users so often complain about.
Benefits of Real User Monitoring
- Passive RUM allows you to monitor traffic and page performance for third-party applications you may not own such as Office 365, Salesforce or Service Now.
- Evaluate application health for end-users no matter where they are accessing the application from, in a remote location, on the road or mobile devices.
- Detect and diagnose root cause where you might not have CloudReady synthetic sensors deployed.

Limitations of Real User Monitoring
One drawback of standalone real user monitoring is that it doesn’t collect data when there are no users actively using an application or SaaS site. Therefore, if you are just using Exoprise Service Watch alone, you may miss outages of an application on that critical Monday morning. Thankfully, by leveraging the complete capabilities of CloudReady, we have your SaaS covered!
Active Monitoring and Real User Monitoring Together
Using either synthetic testing and real user monitoring alone doesn’t provide the best coverage of the application, performance, uptime and availability. However, correlating data from both types of monitoring offers provides a complete and comprehensive view to ensure organizations are fully covered no matter the app, location or network.
