With every webpage loaded, email sent, or video streamed, network traffic takes a complex journey…
This is the second part of a series on the CloudReady dashboards and visualizations. The first part covered basics like Overviews, Refresh, and Layout settings. In this second part, we’ll cover more advanced creation and usage of dashboards. In part 3 and 4 we’ll cover actual widgets and how they can be used.
Also, be sure to checkout our new help site with pages on dashboards and visualizations.

Pinning Layouts to the Left-hand Menu
Layouts or tabs can pinned to the left-hand side menu below the Shared Dashboard link. This can be handy if you want quick, one click access to a particular layout and be able to get to it from anywhere on the site.
To pin a layout to the left-hand menu, make the tab active and click on the Gear icon to see a dropdown menu, then click on the ‘Settings…’. In the configuration dialog that pops up, click the ‘Pin Layout’ checkbox and this will make the tab available via the left-hand menu. You can also rename the tab so that it appears differently in the left-hand side.
See the image to the right for an example of pinned layouts.
Adding New Layouts
Exoprise is always adding new widgets and also offers pre-built layouts for different tasks and to make it easier to get started created your own dashboards.
Testing out new widgets or adding a pre-built layout is easy. To get started just create a new layout using the Plus Icon in the upper right of the Personal Dashboard. Clicking on the plus gives you a dropdown list of pre-built layouts to choose from. Here’s an explanation of some of the layouts:
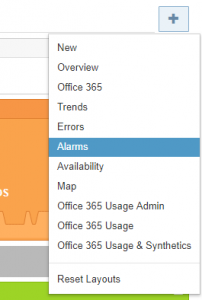
New Layout Dropdown New
This creates a new layout but we pre-load it with a preview of new widgets and other pre-built layouts. Read on for more information about out our preview.- Overview
This is default overview that is created for each user when they first deploy a sensor. Create a new overview if you’ve made changes to your default and want to get back to the default overview. - Office 365
This layout includes the Office 365 Service health widgets. Add this layout and you can follow the links to register your tenant for Service Communications from Microsoft. We call this this 360-degree view of getting Microsoft’s service health status and the CloudReady end-to-end view in one dashboard. - Trends, Errors, Alarms, & Availability
These layouts include a pre-configured Sensor grid (table) that focuses on the critical stats for your sensors. The grids in these layouts can be adjusted and resized for other widgets – they’re just a starting point. - Map
The map layout includes a large map widget that can be resized to accommodate other widgets.
Weekly Report Capture
Every Saturday evening (ET), CloudReady sends out captured dashboard pictures to everyone with active subscriptions. There are two dashboard screenshots and a capture of the Alarm Dashboard. By default, the last selected or visited layout (tab) for both the Personal Dashboard and Shared Dashboard is included.
To configure a specific layout to be used instead of the last visited, open the layout settings for the active tab:
- Make the active that you wish to capture active
- Click the gear icon for the active layout
- Check the box that says ‘Weekly report’. If a different tab is already selected for the active report then this one will take precedence and the other checkbox will be removed.
 +
+Preview Layouts
Sometimes we get asked about a tutorial or video on how to use the dashboards. That’s something we could do once we pause and stop adding features! For now, we do one better, and include a preview layout for each new tab that’s created when you click ‘New’. Think of it as an interactive tutorial for how to create different layouts or try out new widgets.
- Add a Widget
Click this link at the top of the tab to just start adding widgets. Use this if you don’t want to start with one of the pre-built layouts. - Preview New Widgets
Click the ‘Try It’ button in the right to see an example of our latest widgets. This “tutorial” layout will start with a series of new widgets to assist in configuring. For each widget on the page, click ‘Try it’ and you’ll be presented with a widget settings dialog if required. Whenever we release a new widget, we add it to this layout with instructions on how to use it. - Overview
This is a preview and explanation of the default Overview layout. Use this in case you modified your original overview and want to start over. - Office 365
This is a preview and explanation of the Office 365 layout that includes the default setup and the Office 365 service health and outage information.

Dashboard Embedding
Finally, we’ll cover one of the cooler things you can do with CloudReady dashboards which is to embed them in other products. Many network or systems management products support IFRAMEs and the CloudReady dashboards can easily be embedded in an IFRAME. We also have customers that build our dashboards into SharePoint, either SharePoint Online or SharePoint on-premises.
Embedded dashboards are read-only and attached to a specific users account. That’s a good thing as a dashboard will be able to see the same thing as that user sees. And just because anyone can anonymously see an embedded dashboard doesn’t mean they’ll be able to control or alter the CloudReady installation. They will still need to sign in before they can do anything. That’s what we mean by read-only.
Here’s how to embed a dashboard:
- Go to the API and Embedding page which can be found by going to Welcome > Profile > API and Embeding tab.
- In the lower panel, click ‘Enable Embedding’. The system will allocate two tokens, one for the personal dashboards and another for the shared dashboards.
- Cut and paste either URL into an IFRAME for embedding. You can also specify a specific tab by appending an ‘?l=tabno’ to the end of the URL.
The ability to embed dashboards can be controlled for the Organization by admins and owners from the settings page. By default, no one is allowed to embed dashboards, but can be enabled by going to Admin > Settings and checking the box.
 +
+That’s it for the second part in our dashboard and visualization series. Have a look at the third article in this series that covers useful widgets, how to use them and some of their settings.
Related Posts


