With every webpage loaded, email sent, or video streamed, network traffic takes a complex journey…
Your business is already operating in a hybrid model, isn’t it? Perhaps, you are deciding to become an entirely remote workforce. Whatever be the case, IT must support employees working from multiple locations and track remote digital employee experiences using real-time dashboards. In this article, we are going to cover three Digital Experience Monitoring dashboards to help your team identity and troubleshoot problems that your employees might face in their home environment.
So, let’s jump in.
1. Browser-based Real User Monitoring Dashboard
Service Watch Browser is our real user monitoring (RUM) tool for monitoring the digital experience with SaaS applications and services. If you are not familiar with its features, we recommend you visit our page here.
Once you have signed up with Exoprise, click on the “+” sign on the right. Next, go to “Service Watch” and you can find “Service Watch Browser”, which can be added to your dashboard portfolio. Please note that IT must first configure certain browser URLs and deploy the browser extension to Chrome or Microsoft Edge to visualize SaaS performance insights for mission critical apps and services like Salesforce, SharePoint, Workday or others. You can learn more about it on our help documentation site.
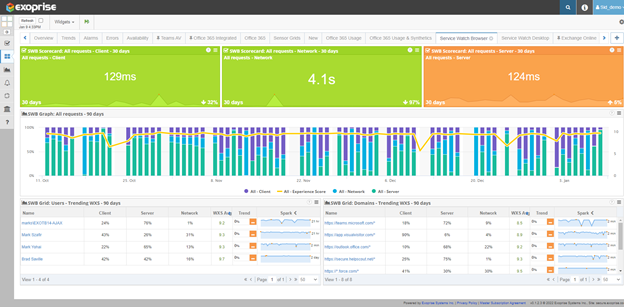
So, what questions can IT answer?
- How is the overall Web Experience for all of my users users?
- Who are my top five employees who need immediate help and priority for troubleshooting?
- What are the top five SaaS web applications that end-users are having trouble accessing?
- Which part of the service chain request (client, network, or server) causes slowness?
- What is the performance trend for each SaaS application for a certain period?
2. Endpoint Monitoring Dashboard
Service Watch Desktop is our endpoint monitoring tool. IT can solve complex network problems associated with desktop apps and services by collecting a vast amount of system resource metrics, low-level TCPIP and UDP network telemetry, and system reliability (crash, fault) information. For more information, have a look at our Service Watch Desktop page.
There are lots of ways for packaging and deploying Service Watch Desktop. It can also be deployed on-demand by an employee who is troubleshooting issues with their home or remote environment. Once deployed, click on the “+” sign on the Exoprise platform. Go to “Service Watch”. Then, you will find “Service Watch Desktop” to expand your portfolio. As soon as you deploy the Desktop agent on your remote user workstations, you should see system resources and device experience data within five minutes. (Assuming the machine is not idle)
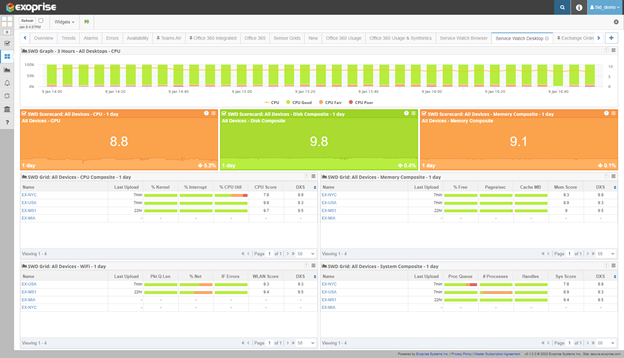
Well, what can Service Watch Desktop help with?
- What is the overall system, WiFi, CPU and Memory performance and trend for all remote devices?
- What are the top users who need a system upgrade to improve their endpoint experience?
- Which systems are suffering from lots of system or application crashes, hangs, blue-screens and other troubles?
- Which system composite metrics tend to go up or down over a selected period of time? Is that across all device groups or certain device groups?
- Which end users have poor experience with their Wi-Fi signal?
3. Custom Digital Employee Experience Dashboard (Our favorite!)
In this dashboard, your team can take advantage of our better together solution – synthetics and real user monitoring – to get the full user experience picture in a single view. Unfortunately, although RUM diagnoses specific user or network problems, it does not help to predict any outage. This is why most of our customers rely on dashboards that combine views and aspects of real user monitoring and synthetic transaction monitoring and make the dashboard application specific. For example, customers create dashboards for business critical enterprise apps such as Microsoft 365 (Teams, Outlook, OneDrive, SharePoint), Salesforce, Zoom, ServiceNow, etc.
You can simultaneously perform application and network monitoring for the Teams AV service as well as understand the end-user perception, latency, packet loss, and hop-by-hop diagnosis of the same service from multiple user workstations in different remote work scenarios that might focus on different Internet Service Providers such as Verizon, Comcast, RCN and others.
To start from a new dashboard, click on the “+” sign and click New. From there, you can add specific widgets or try out a pre-configured layout. To combine proactive, synthetic monitoring in your digital RUM dashboard, you deploy synthetic sensors to any of the previously install Service Watch Desktop endpoints. Learn more on help.exoprise.com.
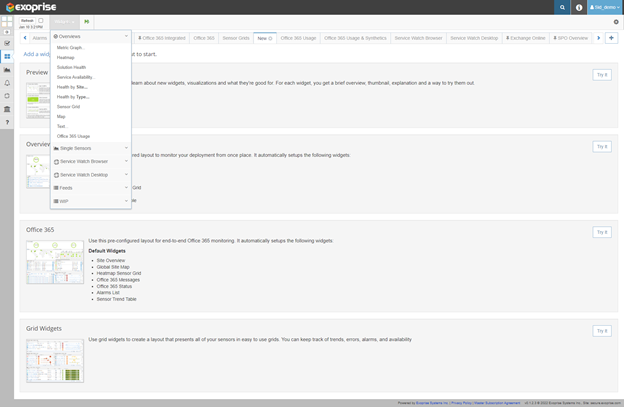
Get your personalized digital experience monitoring dashboard along with widgets that display synthetic data for Office 365/SaaS usage, and Service Watch RUM data from anywhere.
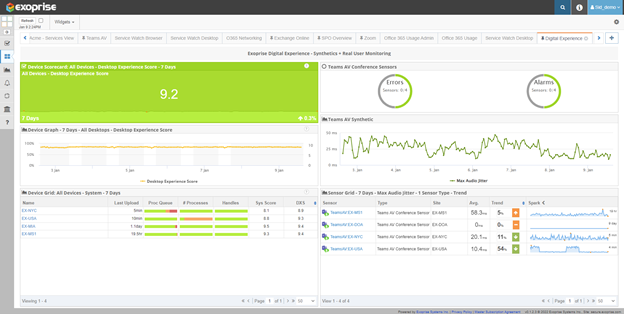
Answer questions related to:
- Does Microsoft Teams have problems everywhere? Which users are affected in regions with problems?
- What is the root cause analysis for when Microsoft Teams is experiencing an outage or slowdown?
- What trends are visible in the performance of Teams Audio Video? How does jitter affect the performance of end-users?
- Does the user device experience improve after fixing Teams issues? And by how much?
Conclusion
Adding existing or customizing new monitoring dashboards is easy in Exoprise. So we designed our product so that you and your team can focus on digital experience monitoring. Nevertheless, we are determined to help you every step of the way and develop a dashboard solution tailored to your business needs.
Our monitoring dashboards reduce the time it takes IT to troubleshoot and locate problems faster by providing rich contextual information and actionable insights.
Contact us immediately for questions or help.
Related Posts


