With every webpage loaded, email sent, or video streamed, network traffic takes a complex journey…
We know there are plenty of Microsoft System Center Operations Manager (SCOM) users out there leveraging SCOM for Office 365 monitoring. The Office 365 Management Pack is available but leaves many gaps in helping IT engineers and ops teams successfully monitor their mission-critical cloud applications like Office 365, Salesforce, Workday & others.
Knowing this, we made it easy to integrate Exoprise CloudReady into Microsoft SCOM for unprecedented visibility into the health, performance and availability. Read on for how you can integrate the two.
End-to-end System Center Operations Manager and Office 365 Monitoring
The Office 365 Management Pack is good for letting you know when Microsoft detects a problem with their infrastructure but it does nothing to help you understand how your own end-to-end network paths are operating or the end-user experience Microsoft’s Office 365. The Office 365 Management Pack, which gives you alerts about your tenancy straight from the Office 365 Service Communications API (the same one we use too), is sometimes slow to be updated and the updates are often after an incident has occurred. Your end-users will likely experience a problem before the Office 365 Management Pack knows about it.
With CloudReady you can easily deploy sensors across your network wherever you have end-users accessing Exchange Online, SharePoint Online, ActiveSync, and Skype for Business (and more…), so you can know proactively and in real-time when problems are occurring on your end AND Microsoft’s within your tenancy.
Easy as clicking one buttons (ok, two)
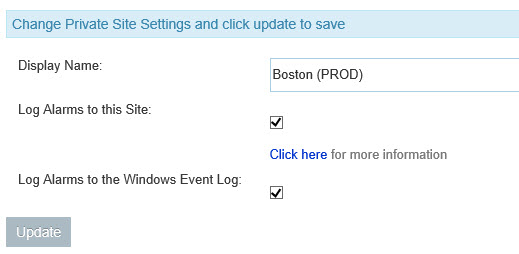
Integrating our end-to-end synthetic monitoring is as easy clicking two buttons and setting up an NT Event Rule within the Microsoft’s SCOM Operations Console. By configuring a CloudReady Private Site to receive alarms and resolutions, all performance and error alarms will magically appear in the System Center Operations Manager Operations Console. Even better, you only have to do this from one location. If you have multiple CloudReady sites deployed with sensors spread around the world, the alarms will be consolidated to whichever site you designate to receive them. You can also designate multiple sites to receive them (its pubsub) for redundancy too.
We also have customers that integrate our alarms into Splunk, Nimsoft and other management and monitoring systems.
[content type=page name=cta_chr_office_365 status=private]
What You Get
By default, out-of-the box, when you enable NT Event Log propagation, you’ll receive the alarms and alarm resolutions as soon as they occur. The resolutions are important because network glitches and tenancy problems can be sometimes be transient — so it depends on how quickly you want to know about a problem or how long to wait to ensure that there are no false positives.
The alarm data is logged in an easily parsed JSON format and includes the links back to the alarm configuration, the sensor and configuration. Here’s an example payload:
{"dataFormatVersion":"1.0.0","event":"ring","eventDescription":"Threshold crossed: 2 datapoint(s) were > to the threshold (60555). The most recent datapoints(s) were: [74531.0, 108905.0] at \"2014-12-14 10:10:00 UTC\" (local: December 14, 2014 05:10) ).","eventTimeStamp":"2014-12-14T10:12:50.650Z","sensorUrl":"https://secure.exoprise.com/share_point_sensors/1734","sensorName":null,"sensorTitle":"SP:Palo Alto:SPgdust","sensorType":"SharePointSensor","sensorLocation":"AZWESTSENSOR","sensorLastUploadAt":"2014-12-14T10:11:42.000Z","sensorCreatedAt":"2014-01-03T20:31:22.000Z","alarmType":"data","alarmUrl":"https://secure.exoprise.com/alarms/1304","alarmName":"SharePointSensor: logon_time alarm","alarmElement":"logon_time","alarmElementTitle":null,"alarmElementDescription":null,"alarmCondition":"when \"logon_time\" is \">\" than \"60555\" for 2 sensorinterval(s)","alarmAccount":"[email protected]","sensorDataPoints":[74531,108905]}
More information about alarm logging can be found here and details about the NT Event Log format can be found here.
How to Create a CloudReady Rule In Operations Manager 2012 R2
Creating a rule for CloudReady NT Event Alarms is very easy:
- Open the Operations Manage Console
- Go to Authoring -> Management Pack Objects
- Right click on Rules -> Create a new rule
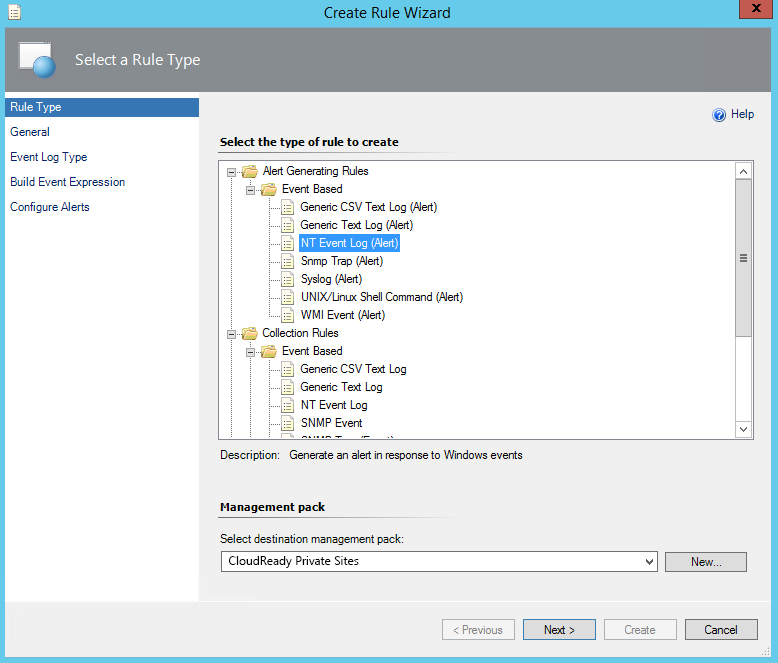
- Open the Alert Generating Rules -> Event Based and select NT Event Log (Alert)
- Select the destination Management Pack that corresponds to where you’ve installed a CloudReady Private Site that is configured to receive alarm publishing
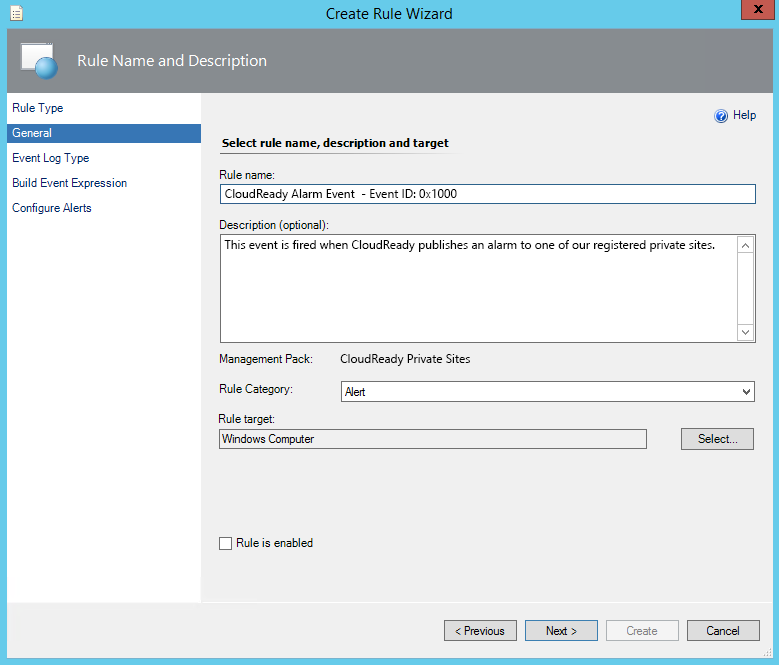
- Set the rule name for the CloudReady alarms
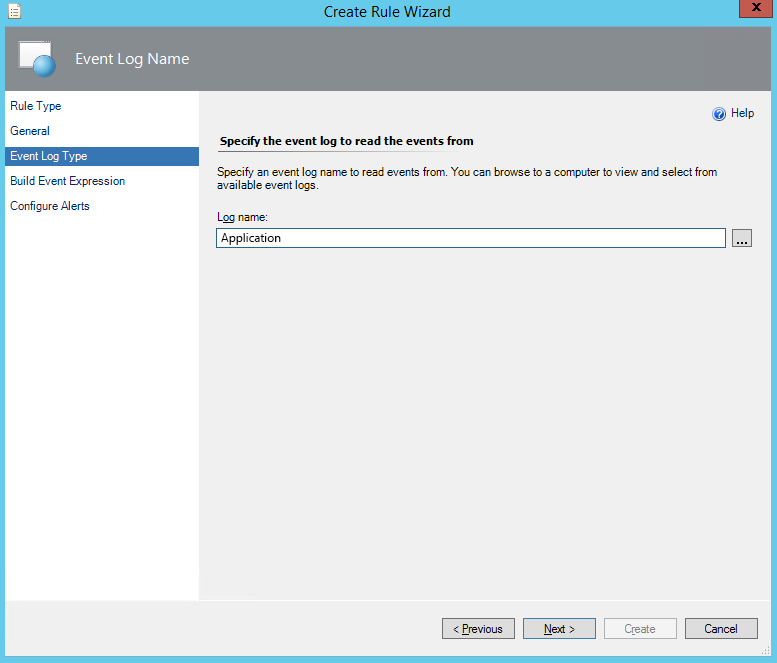
- Specify to read from the Application event log
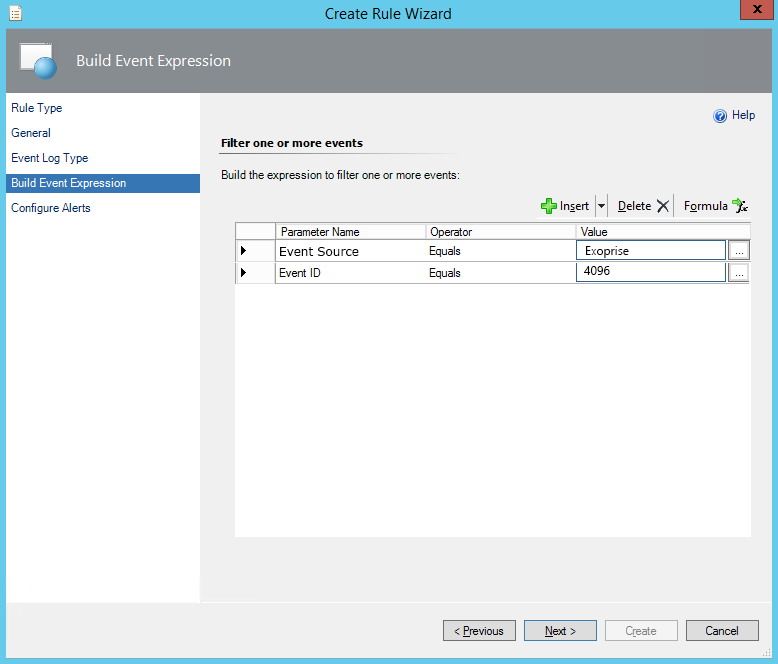
- Build an event expression based on the “Event Source = Exoprise” and the “Event ID = 4096”. You can specify different actions for the resolution (event id 4097). You can also further parse the Event Data for more specifics
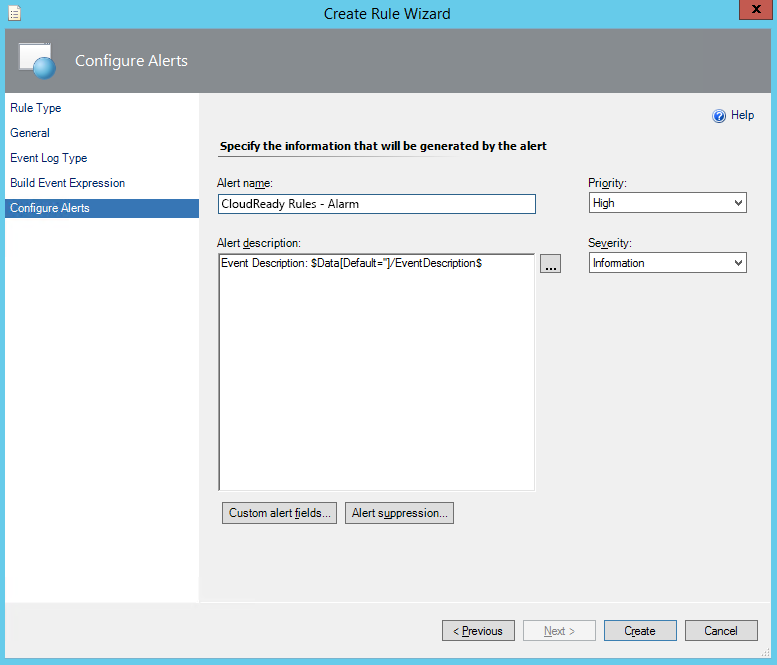
- Finally name your rule and select a priority for the rule
Get Started with Microsoft System Center Operations Manager and Exoprise
That’s all it takes for a complete 360° view into the performance and availability of your Office 365 deployment. We call it a 360° view because you get notifications from Microsoft about when they are having an issue and real-time publish/subscribe notifications from monitoring tools like CloudReady when your side, your networks, or your Office 365 tenancy are having issues. Plus, you can easily setup CloudReady sensors for other mission-critical SaaS applications that your organization is using like Salesforce, Box, Okta, Ping, etc., and collect data.
Give it a spin and let us know if you have any questions. Visit Exoprise for more information.
