With every webpage loaded, email sent, or video streamed, network traffic takes a complex journey…
Microsoft Dynamics and Dynamics 365 are product lines encompassing enterprise resource planning (ERP) and customer relationship management (CRM) software applications. If you’ve made the shift to Dynamics 365 for its powerful combination with Office 365, then you need to monitor Microsoft Dynamics to ensure its uptime and performance.
Dynamics, the on-premises version, has been in existence since 2009, while Dynamics 365, the cloud-based version, just got its start in the middle of 2016. Microsoft Dynamics 365 paid seats have more then doubled in the past year. Revenue is expected to grow due to the combination of the acquired LinkedIn Business Solutions and Dynamics 365.
Dynamics 365 was built in the cloud. It’s a subscription-based, pay-as-you-consume model that combines the best of Microsoft Dynamics ERP and Microsoft Dynamics CRM functionality into a fully integrated solution. We’re not going to try and (even briefly) pin down the various versions available – they change as Microsoft continues to innovate. You can see more about all of the applications that are part of the different plans, right here: https://www.microsoft.com/en-us/dynamics365/pricing. Microsoft Dynamics is a tremendous set of applications with incredible value for Organizations of any size.
Monitor Microsoft Dynamics 365 from Your Place or Ours
The Exoprise Customer Success team has fielded many requests for the ability to monitor Microsoft Dynamics 365 from CloudReady, integrated with the rest of our comprehensive monitoring for Office 365. Just like with Office 365, when customers start to embrace Dynamics across an organization, it becomes critical to ensure connectivity and performance to Dynamics from all points throughout a company’s network. Customers need to ensure that the end-user experience is acceptable for Dynamics users.
While our WebLogin sensors were up to the task of monitoring Dynamics already, customers wanted CloudReady to go the extra mile, perform additional dashboard navigation, and segregate the Dynamics crowd data for better problem resolution, network & performance bench-marking. We’re happy to reveal the release of our CloudReady Dynamics 365 Sensor. Here’s a little more information.
Dynamics 365 is a Big Application
We’ve only begun to tap the basics of what Dynamics 365 can do for our Exoprise organization but we know its a big application that can be very resource intensive and thus it can be slow. During our Dynamics Trial, it seemed even slower while getting into the application, through something called the redirector and getting into the different dashboards.
For the CloudReady Dynamics 365 Sensor, we support navigating between two different dashboards as part of the script-less monitoring that CloudReady provides. The sensor will:
- Login through Microsoft’s standard login
- Navigate, test and monitor any Single Sign-On solutions that your tenant has in place, depending on whether you’ve set the sensor up as a Federated or Managed account
- Enter the Dynamics 365 application and wait for any and ALL of the default dashboards for account to load
- Navigate to a user-configurable alternative dashboard. You can select which dashboard you would like to navigate to.
Dashboards in dynamics are where most of the main interaction occurs or starts and they are very customizable. They also can be a tad slow due to the nature of how “dynamic” they are. Dashboards use IFRAMEs (sub-pages) to load their content and the CloudReady sensor does extra work to make sure that the sub-content and pieces are fully loaded. Most of the time, the page may begin to appear to be loaded but more pieces of the Dynamics application are loading in the background and they all need to be present before the application can be interacted with. These are part of the timings that we record and the customization that we’ve done to monitor Dynamics 365.
See What You Can See With CloudReady Monitoring for Dynamics 365
When you deploy CloudReady to monitor Microsoft Dynamics 365, you get comprehensive analytics and insight into the network and server performance whether the application is provider-hosted, Microsoft-hosted, or self-hosted. Detailed views, alarms and elements across the full login (including Single Sign-On metrics), dashboard generation and delivery. You also get a comprehensive look at all of the servers and page parts that make up a Dynamics application. These analytics are critical for:
- Ensuring uptime and availability for Dynamics 365 to make sure your SLA’s are being met
- Diagnosing network connections, speed, latency and throughput to the Dynamics application
- Diagnosing any potential issues with proxy connections, ISPs, gateways or security devices that may be in the network path
- Understanding when Microsoft makes a change to the delivery of Dynamics 365 and how that change is affect application delivery
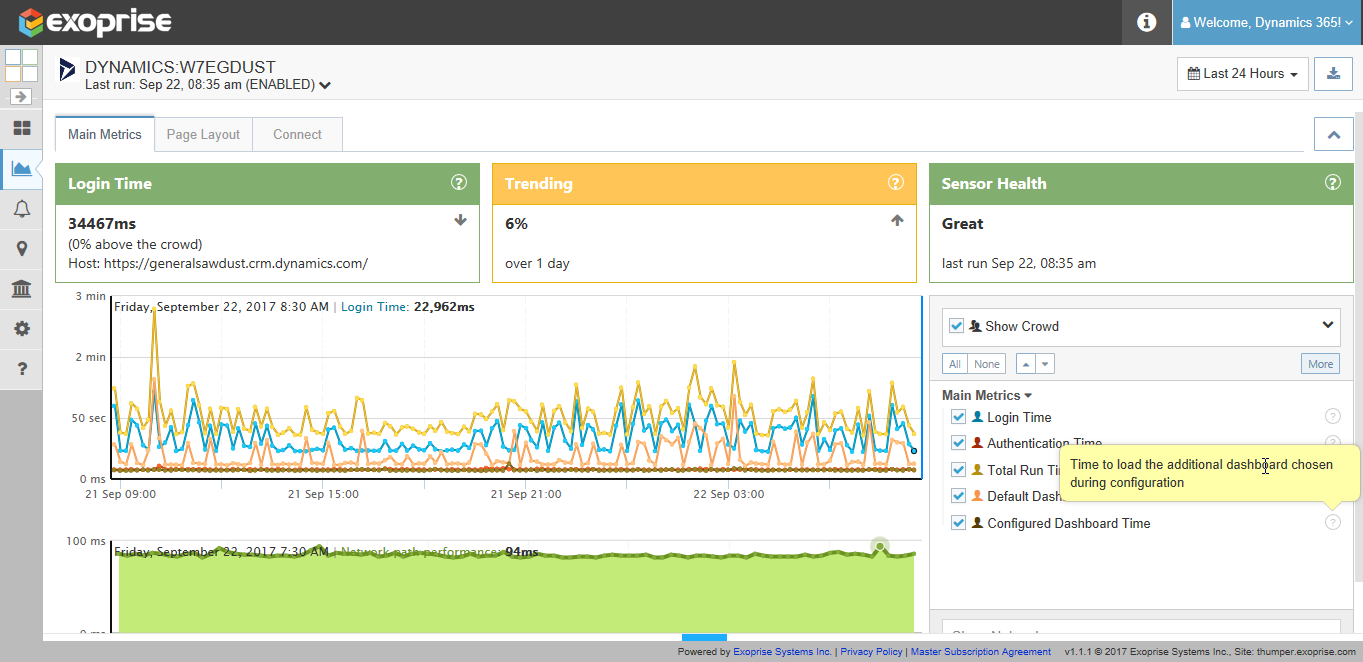
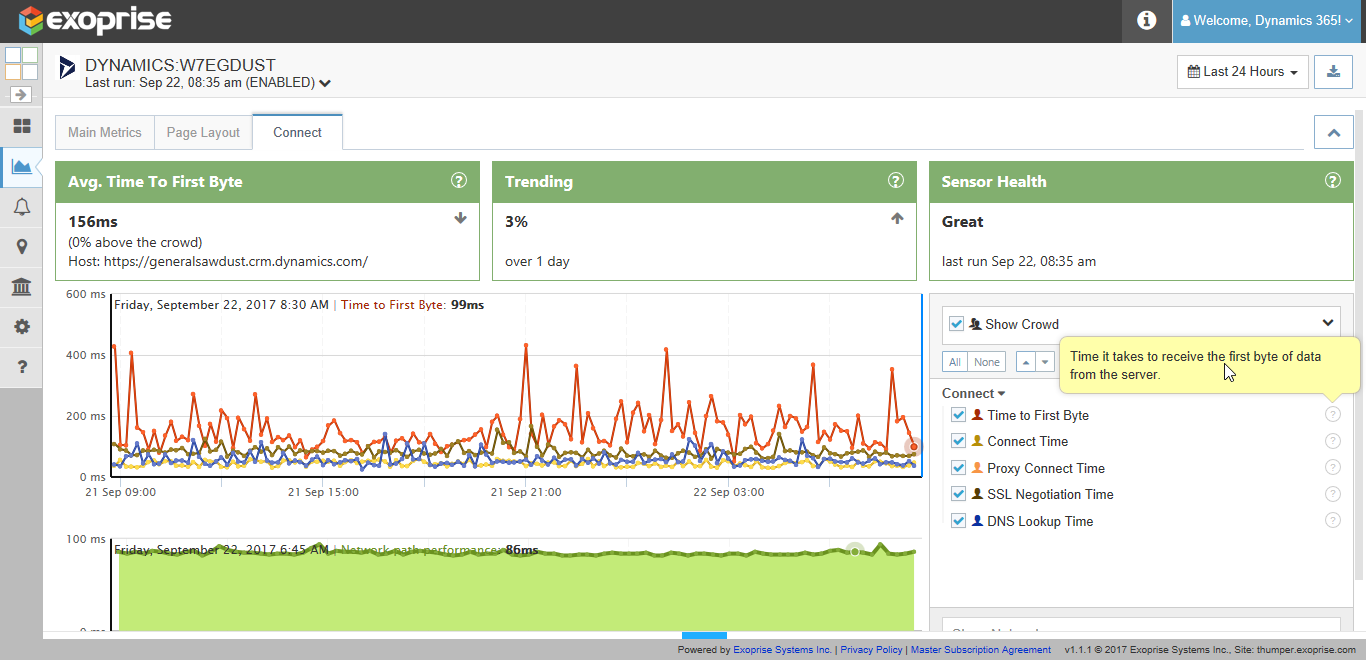
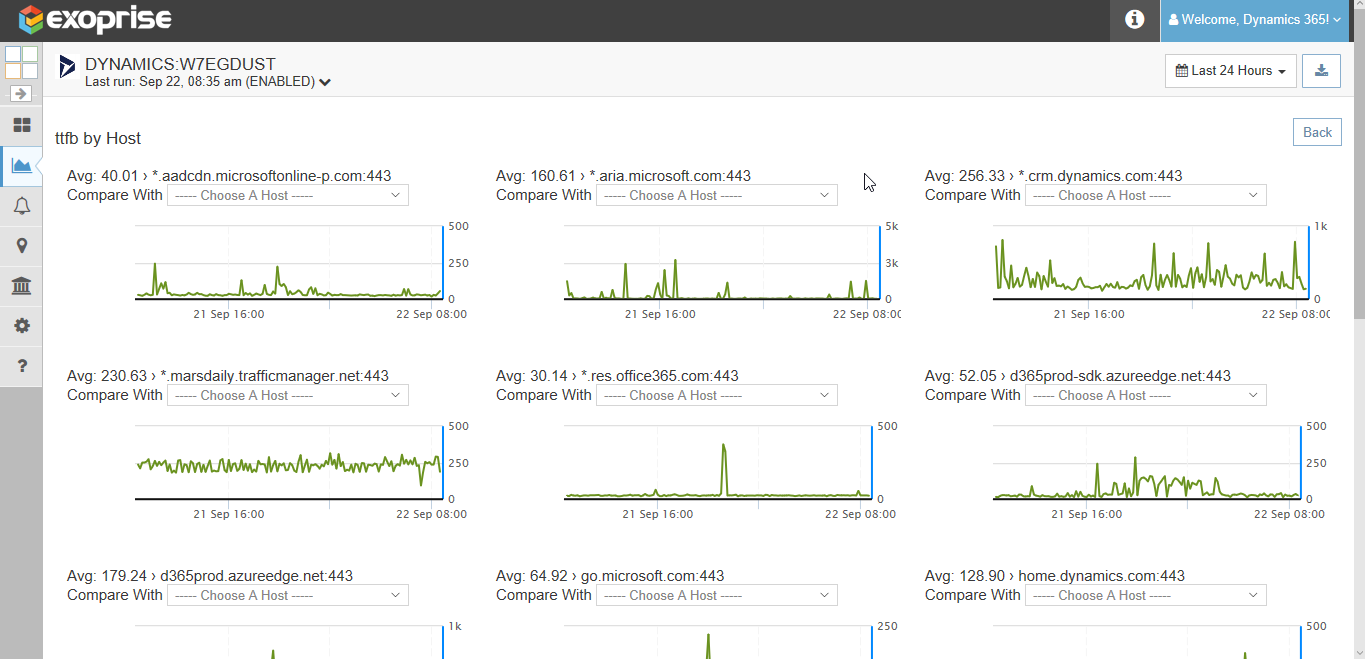
Here’s a sample set of visualizations for the CloudReady Dynamics 365 sensors:
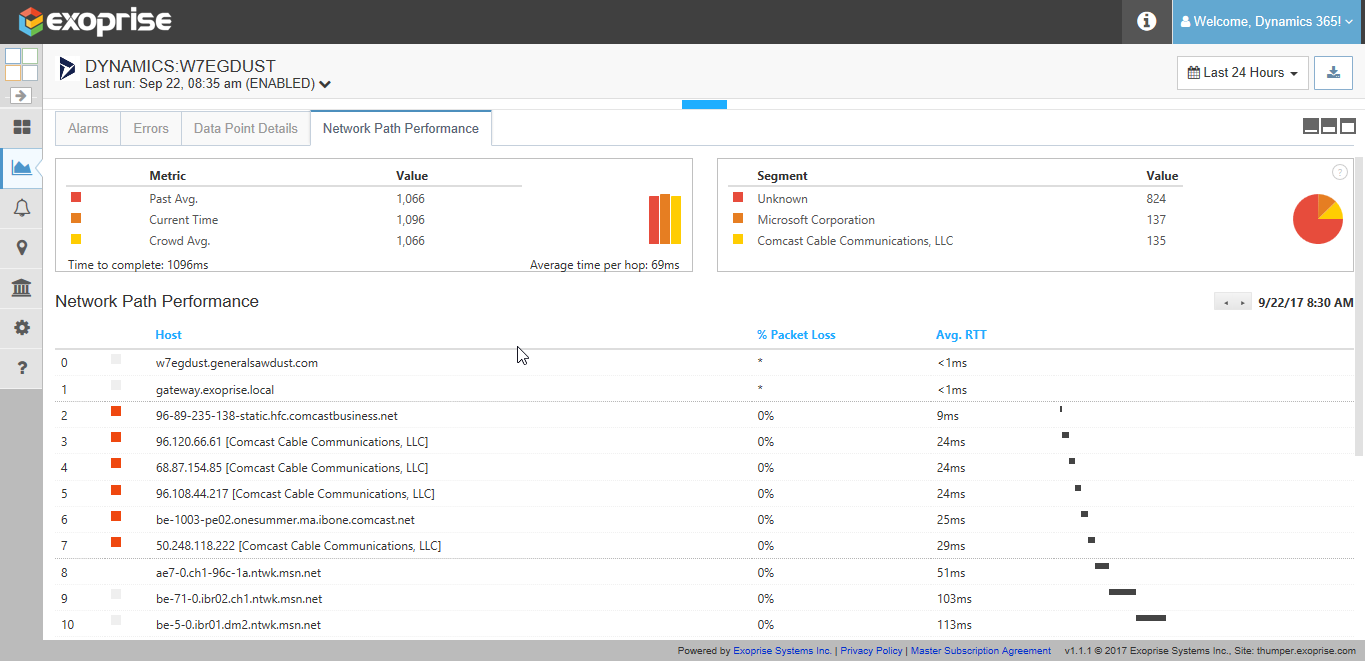
Related Posts


