With every webpage loaded, email sent, or video streamed, network traffic takes a complex journey…
Software as a Service (SaaS) is a mainstream way of bringing enterprise applications to hundreds of thousands of application users at a stable cost. Rather than loading client software on a desktop PC, we lease software from the cloud, and monitor how the SaaS application is delivered. That makes it available to everyone in the enterprise.
Salesforce started this trend back in 2006. Today, thousands of organizations collectively have millions of seats of the Salesforce.com CRM software. Other enterprise applications, such as SAP, SharePoint, and the Microsoft Office 365 suite have followed suit.
Why SaaS?
The SaaS approach simplifies enterprise application deployment, maintenance, and upgrades. These characteristics enable IT professionals to spend time on more complex activities with a higher ROI. However, this doesn’t mean that SaaS delivery of enterprise applications is trouble-free. Because it’s delivered from the cloud, network administrators have to be cognizant of performance and availability. Whether it’s because of delivery issues on the Internet, or slow routing on your own network, your users may not be getting the performance you are paying for.
Service-Level Agreements or SLAs are one answer, but those arbitrary numbers often don’t bear any relation to the real end-user experience. Instead, it can make more sense to collect raw performance data, and compare it with the aggregate of everyone else using that service. We, here at Exoprise, call this crowd-powered.
What to Monitor in Your SaaS Applications
There are a wide variety of performance statistics that you can collect, and there are no right or wrong answers to which are most important. It really depends upon what measures are most important to the enterprise. By synthetically monitoring the end-user perspective of your most common or used applications, you can start to understand the performance characteristics of the apps.
For example, login time may be important to many enterprises as this often tests the end-to-end availability of the application, proxies, gateways, Single Sign-on infrastructure and more. Alternatively, you may be interested in how long it takes for the browser to fully load a page, or how long it takes for a query to return a result. There are many possible measurements that provide insight into how a remotely accessed application is behaving.
[content type=page name=cta_trial status=private]With Exoprise CloudReady, we ensure most sensors perform the same actions across SaaS applications, so the actions and metrics are common across customers. This then allows us to anonymously aggregate and compare those statistics, and this is what we call the “crowd”. It’s quite helpful to see an instantaneous benchmark for your performance compared to others. It helps bring meaning to the numbers. Here are some examples:
Crowd Powered Metrics
- Logon Times
Overall logon time is captured from the start of page navigation through to when the initial site page is visible. This is a good place to start when analyzing the overall health of a SaaS application.
Crowd Benchmark
When the logon time is above the crowd, you should filter the crowd metrics to determine if it’s a regional issue or investigate further to determine the root cause. Further, you should investigate your Network Path Performance from where the sensor is running and the cloud app. With our network views, you can understand what segments of the network are performing slowly and need improvement. Those improvements might entail switching ISPs or internal routing. - DNS Lookup
Domain Name Service performance is critical for accessing ALL of your applications and services. DNS lookup time is captured across every sensor run for every asset and retrieval.
Crowd Benchmark
When DNS lookup time is performing worse than the crowd, you should investigate the LAN-based DNS server caching. Many cloud-based services such as SharePoint Online bring together content from a wide array of servers and resources, and this requires fast DNS performance with a large amount of local and LAN-based caching.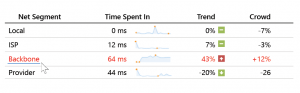
Network Segment Comparisons to the Crowd - TCP/IP Connect
Connect times are captured for every connection during a sensor run and reflect the underlying network latency. Reducing latency is critical to ensuring fast SaaS and web-based application performance.
Crowd Benchmark
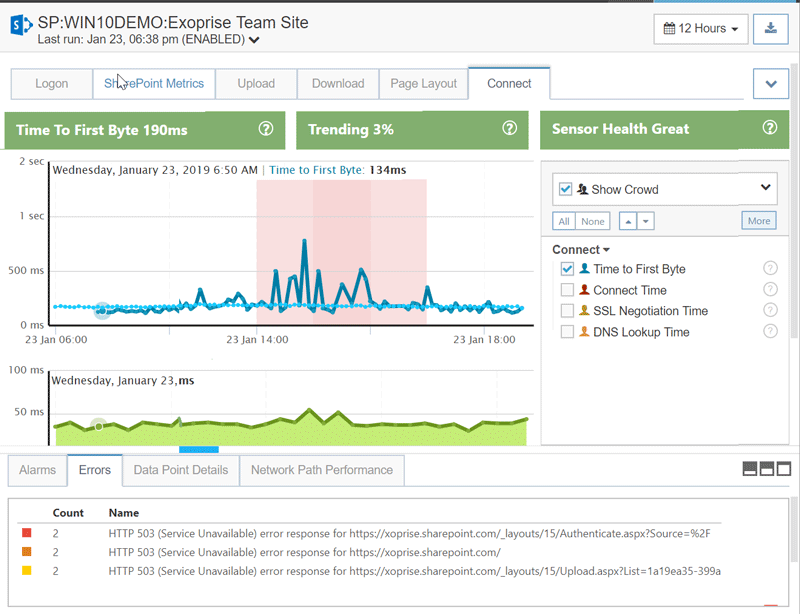
If measured latency is consistently above the crowd, then you should contemplate adding additional network capacity or possibly adjusting your network gateways and proxies. - Time-to-first-byte (TTFB)
This metric is a good indicator of server response time and should be close to TCP/IP connect time. When the value is high, it’s an indicator of an overloaded server.
Crowd Benchmark
When TTFB is above the crowd, it indicates that the server is responding more slowly. If TTFB is higher but, for something like a SharePoint server, health scores are lower or not elevated, then there is a network issue at the provider or somewhere along the network path.
This is a small sample of the kind of instant benchmarking a network administrator can get during a CloudReady trial. But we can also go beyond performance to application availability. Applications delivered from the cloud are subject to network disruptions, both intentional and accidental. Network administrators need to get ahead of the curve, and inform their users of outages, rather than the other way around. The only way that can happen is if you are also monitoring availability. You can monitor availability by looking at key metrics, such as page load time, errors, and network path performance to determine if the application is trending toward failure.
Toward a SaaS Monitoring Solution
Exoprise CloudReady provides the ability to monitor a wide variety of characteristics of SaaS enterprise applications such as Office 365, Microsoft Dynamics, and SharePoint. By installing sensors within and outside your network, you can collect thousands of metrics. Those metrics will give you raw performance and error data. You can also compare your data with everyone else using that CloudReady sensor. Further, you can set alarms to tell you when your performance or error rates are exceeding your expectation.
It’s important to be proactive with the performance of SaaS enterprise applications. The enterprise is dependent on external as well as internal technologies to operate well. Also, a performance issue or outage affects every user of the application. Ultimately, it may be something within your control, and monitoring can help diagnose it. But you can’t predict, identify, or diagnose issues with your SaaS applications unless you can measure them first.
Related Posts


