With every webpage loaded, email sent, or video streamed, network traffic takes a complex journey…
Salesforce.com is an essential mission-critical application for many enterprises. Because it is only delivered through the cloud, its performance is highly dependent upon where it is being served from, accessed from, end-to-end network characteristics, and type of usage within an enterprise.
As the premier CRM solution on the market, Salesforce.com is an essential tool for sales professionals, marketers, strategists, and even manufacturing, shipping, and inventory specialists. Minutes of downtime can disrupt hundreds of thousands of dollars worth of business and delivery while impacting the end-user experience.
New Lighting Experience
The most recent Salesforce.com release, called Lightning, is a major upgrade supporting a richer user experience, progressive rendering, more customization, and control. More content is rendered on the client when using Salesforce Lightning and there are more dependencies on the overall end-to-end network quality to ensure a robust end-user experience.
With the new release, you can no longer just perform a WGET or PING against a Salesforce data center and measure a simple response time. To fully measure the health and performance of the Salesforce experience you must exercise and measure the application as a user would. With progressive web apps, measuring the end-user experience means taking into account when the application reaches a “usable state” – a time when the user can begin to meaningfully interact with the application.
Let’s discuss salesforce performance best practices.
Optimize SaaS and Network Apps Today
You can monitor Salesforce CRM performance using Exoprise synthetic sensors — without the need to create any custom script. That’s how we are different. Other vendors require complex and sometimes custom requirements for building scripts that will test and monitor your app performance. Not at Exoprise, as we do all the heavy lifting for you. That way, your team focuses on important IT tasks.
Salesforce Proactive Monitoring
Application Performance Monitoring of Salesforce is something every enterprise subscriber should be doing. Fortunately, Exoprise CloudReady makes that easy. Its Salesforce.com sensor lets you proactively monitor and measure Salesforce response time and behavior in a number of different ways.
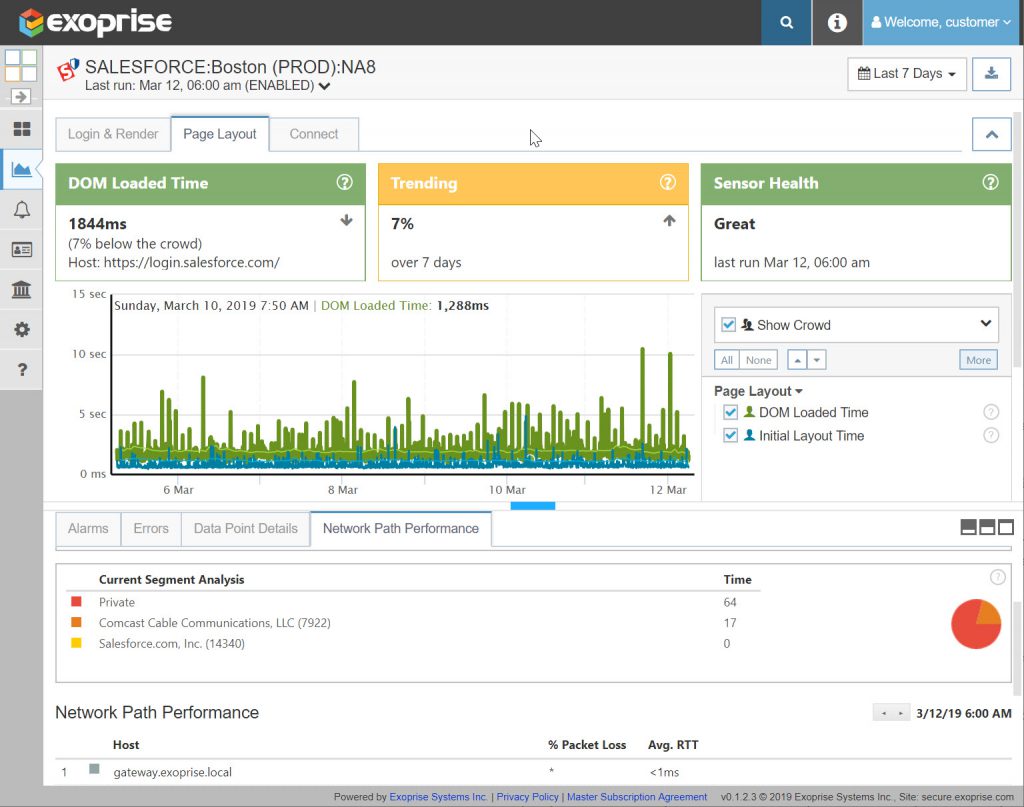
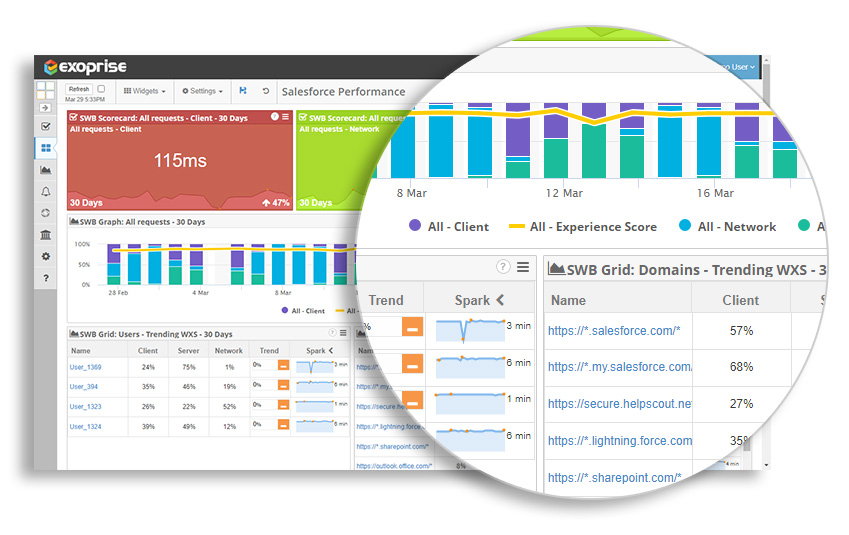
The CloudReady Salesforce sensor is compatible with the new Salesforce Lightning experience and generates metrics based on the end-to-end performance, log in and Render, Page Layout, and Connect Times. Login and Render provide the average time it takes to successfully log in and retrieve the progressive web pages. The Salesforce sensors are smart enough to measure when the application has been delivered and the page is ready to be interacted with. It displays the milliseconds, how it compares to the crowd averages, and how it is trending over time.
This is a good place to start. If your enterprise is a single location, deploying a single synthetic Salesforce sensor will enable you to baseline your network and access to Salesforce.com and assist in eliminating guessing about whether the network or providers are the problems when you have a slow response time. Salesforce performance benchmark with crowd-sourced analytics reduces MTTR because your team knows if the problems are with your tenant only or worldwide.
If you have multiple geographically separated locations, you will be better served by deploying more sensors wherever you have end-users that are dependent on Salesforce. Since progressive web apps are more dependent on client-side rendering than regular web server pages, Exoprise recommends that you set up CloudReady sensors on devices that are representative of the typical client workstations to properly gauge the real user experience of the page load times. Monitor salesforce performance from multiple vantage points to ensure availability and uptime for remote employees.
For more information on coverage, read this: Are You Covered? Factors in CloudReady Monitoring Coverage
Real User Monitoring for Salesforce
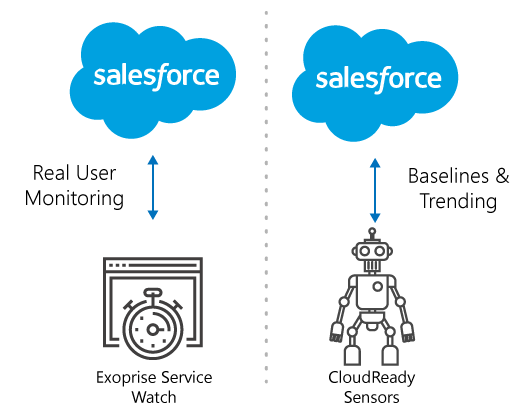
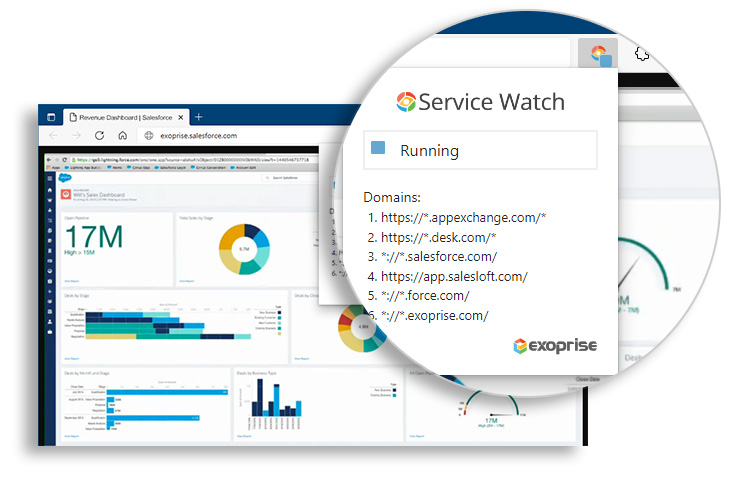
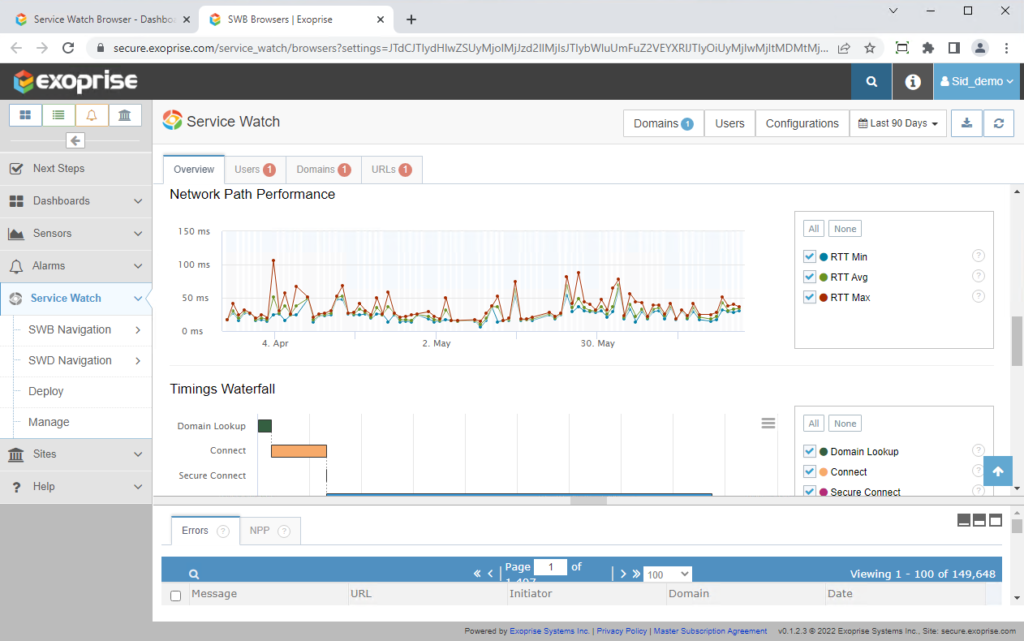
From the standpoint of the user, we might also want to use Exoprise Service Watch so that we can look at what the actual end-user is experiencing. Service Watch monitors the end user performance by watching the browser, for configured URLs and domains, and is especially useful when those users are remote or complaining of poor performance. You can configure several Salesforce web pages in the browser agent depending upon what areas of the CRM your users access. When employees complain about “this page isn’t available in Salesforce lightning experience”, use Service Watch RUM to diagnose the issue whether with the LAN/WAN/ISP or service provider.
Synthetic and Passive Monitoring for Salesforce Performance Issues
The combination of CloudReady synthetic sensors for Salesforce and Service Watch enables administrators and network operators to be completely covered; synthetic sensors ensure that the app is performing regardless of whether a user is using it and real-user monitoring gives you coverage wherever users might be operating from.
And, as always compare your performance to that of the crowd. In addition to enabling you to benchmark your performance against others, it helps you determine if any issues that arise are due to the application or the network. Other network-oriented sensors, such as DNS or bandwidth sensors, can be helpful in identifying and diagnosing Salesforce.com issues.
Exoprise is the ONLY vendor that provides rich synthetics and complete coverage – better together – for Salesforce in a single solution. You can download our whitepaper to learn more.
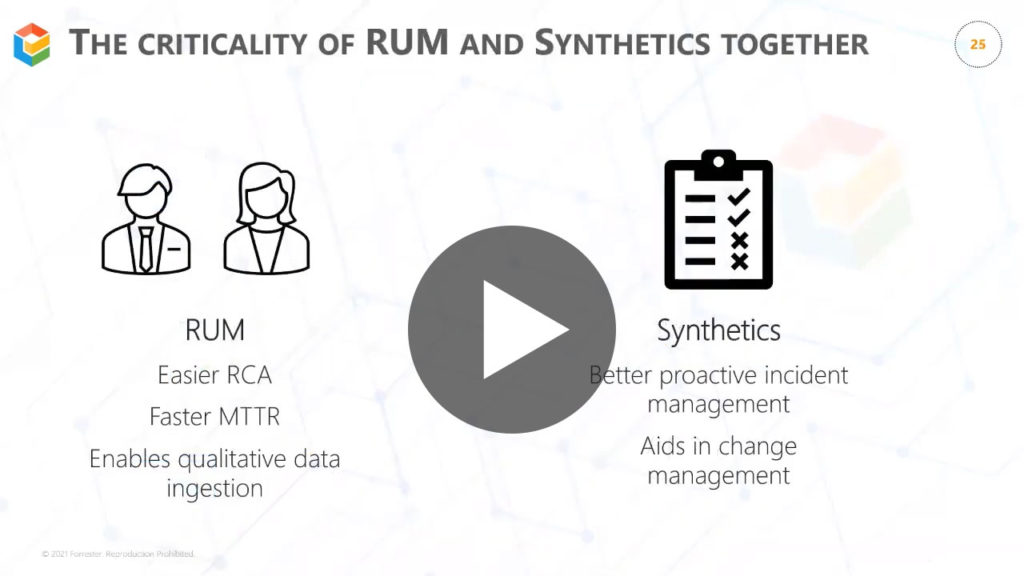
Watch why synthetic and real user monitoring together makes sense for any business
Try Our Salesforce Monitoring Tool
Monitoring and ensuring good Salesforce performance is critical to the health of your business. When Salesforce response time suffers so does the effectiveness of your users. Salesforce performance optimization is an ongoing task for network admins in any company. The following are important considerations for monitoring Salesforce in real-time:
- Measure Salesforce availability, uptime, and performance in network conditions similar to how a real-user would experience them, especially it comes to latency between the user and the CRM instance
- Try and emulate a real users device and browser constraints when synthetically testing Salesforce
- Use Salesforce performance monitoring tools like CloudReady and Exoprise Service Watch for Salesforce real-user monitoring (our new page!)
Exoprise also offers an SLA report on Salesforce availability and uptime status. You can always use the report to claim credits in case of a downtime or outage.
Related Posts


