With every webpage loaded, email sent, or video streamed, network traffic takes a complex journey…
Exoprise Service Watch, our real-user monitoring (RUM) product, recently improved support for monitoring a Single-Page App (SPA) which have become the foundation for many Software-as-a-Service applications like GSuite, Salesforce Lightning, or Microsoft’s Outlook Web Access. SPAs have unique requirements when it comes to capturing and monitoring end-user experience especially through different network configurations, proxies, firewalls and branch office users.
According to wikipedia, Single-Page Apps are web applications or web sites “that interacts with the user by dynamically rewriting the current page rather than loading entire new pages from a server. This approach avoids interruption of the user experience between successive pages, making the application behave more like a desktop application”.
SPAs use JavaScript and background requests to fetch resources and build pages. This should create a faster user experience similar to desktop or mobile applications. React and Angular are two popular JavaScript frameworks used to create SPAs. Many parts of CloudReady itself are SPAs utilizing Angular and other frameworks.
The Rise of Single-Page Apps
Single-page Applications are all about creating a superb User Experience (UX) and more SaaS/Cloud applications are trying to deliver that “desktop”-like experience i.e. no page reloads, no extra wait time. Typically, with a SPA, you visit and load a single web page and, as you interact with the application, content and actions are executed in the background and parts of the page are re-rendered.
The background requests and memory become an issue with single-page apps because the main page is long running and there are frequent XHR requests that alter the page(s) as time goes on. When it comes to real-user monitoring, request queuing and background XHR/Ajax requests become just as important as the full browser navigation requests. Exoprise Service Watch highlights both.
Service Watch with Enhanced Support for Single-Page Apps
Service Watch enables network administrators and application owners to get the end user perspective of the application and network experience. Combining Service Watch browser extensions with network path performance from CloudReady Private Sites enables end-to-end visibility for SaaS and internal apps no mater where the user is located or what type of network they’re on; wireless, wired, VPN or remote.
- Monitors the performance of user experiences of SPAs, especially background utilization
- Troubleshoot and resolve SPA problems for apps you own or SaaS apps like Salesforce, Office 365 and GSuite
- Diagnose slowdowns whether they’re coming from the the client, the network or the server
- Combined with Exoprise’s Network Path Performance data, diagnose which parts of the network, proxies, gateways or ISPs are slowing your apps
How To Analyze SaaS Performance Using Exoprise Service Watch
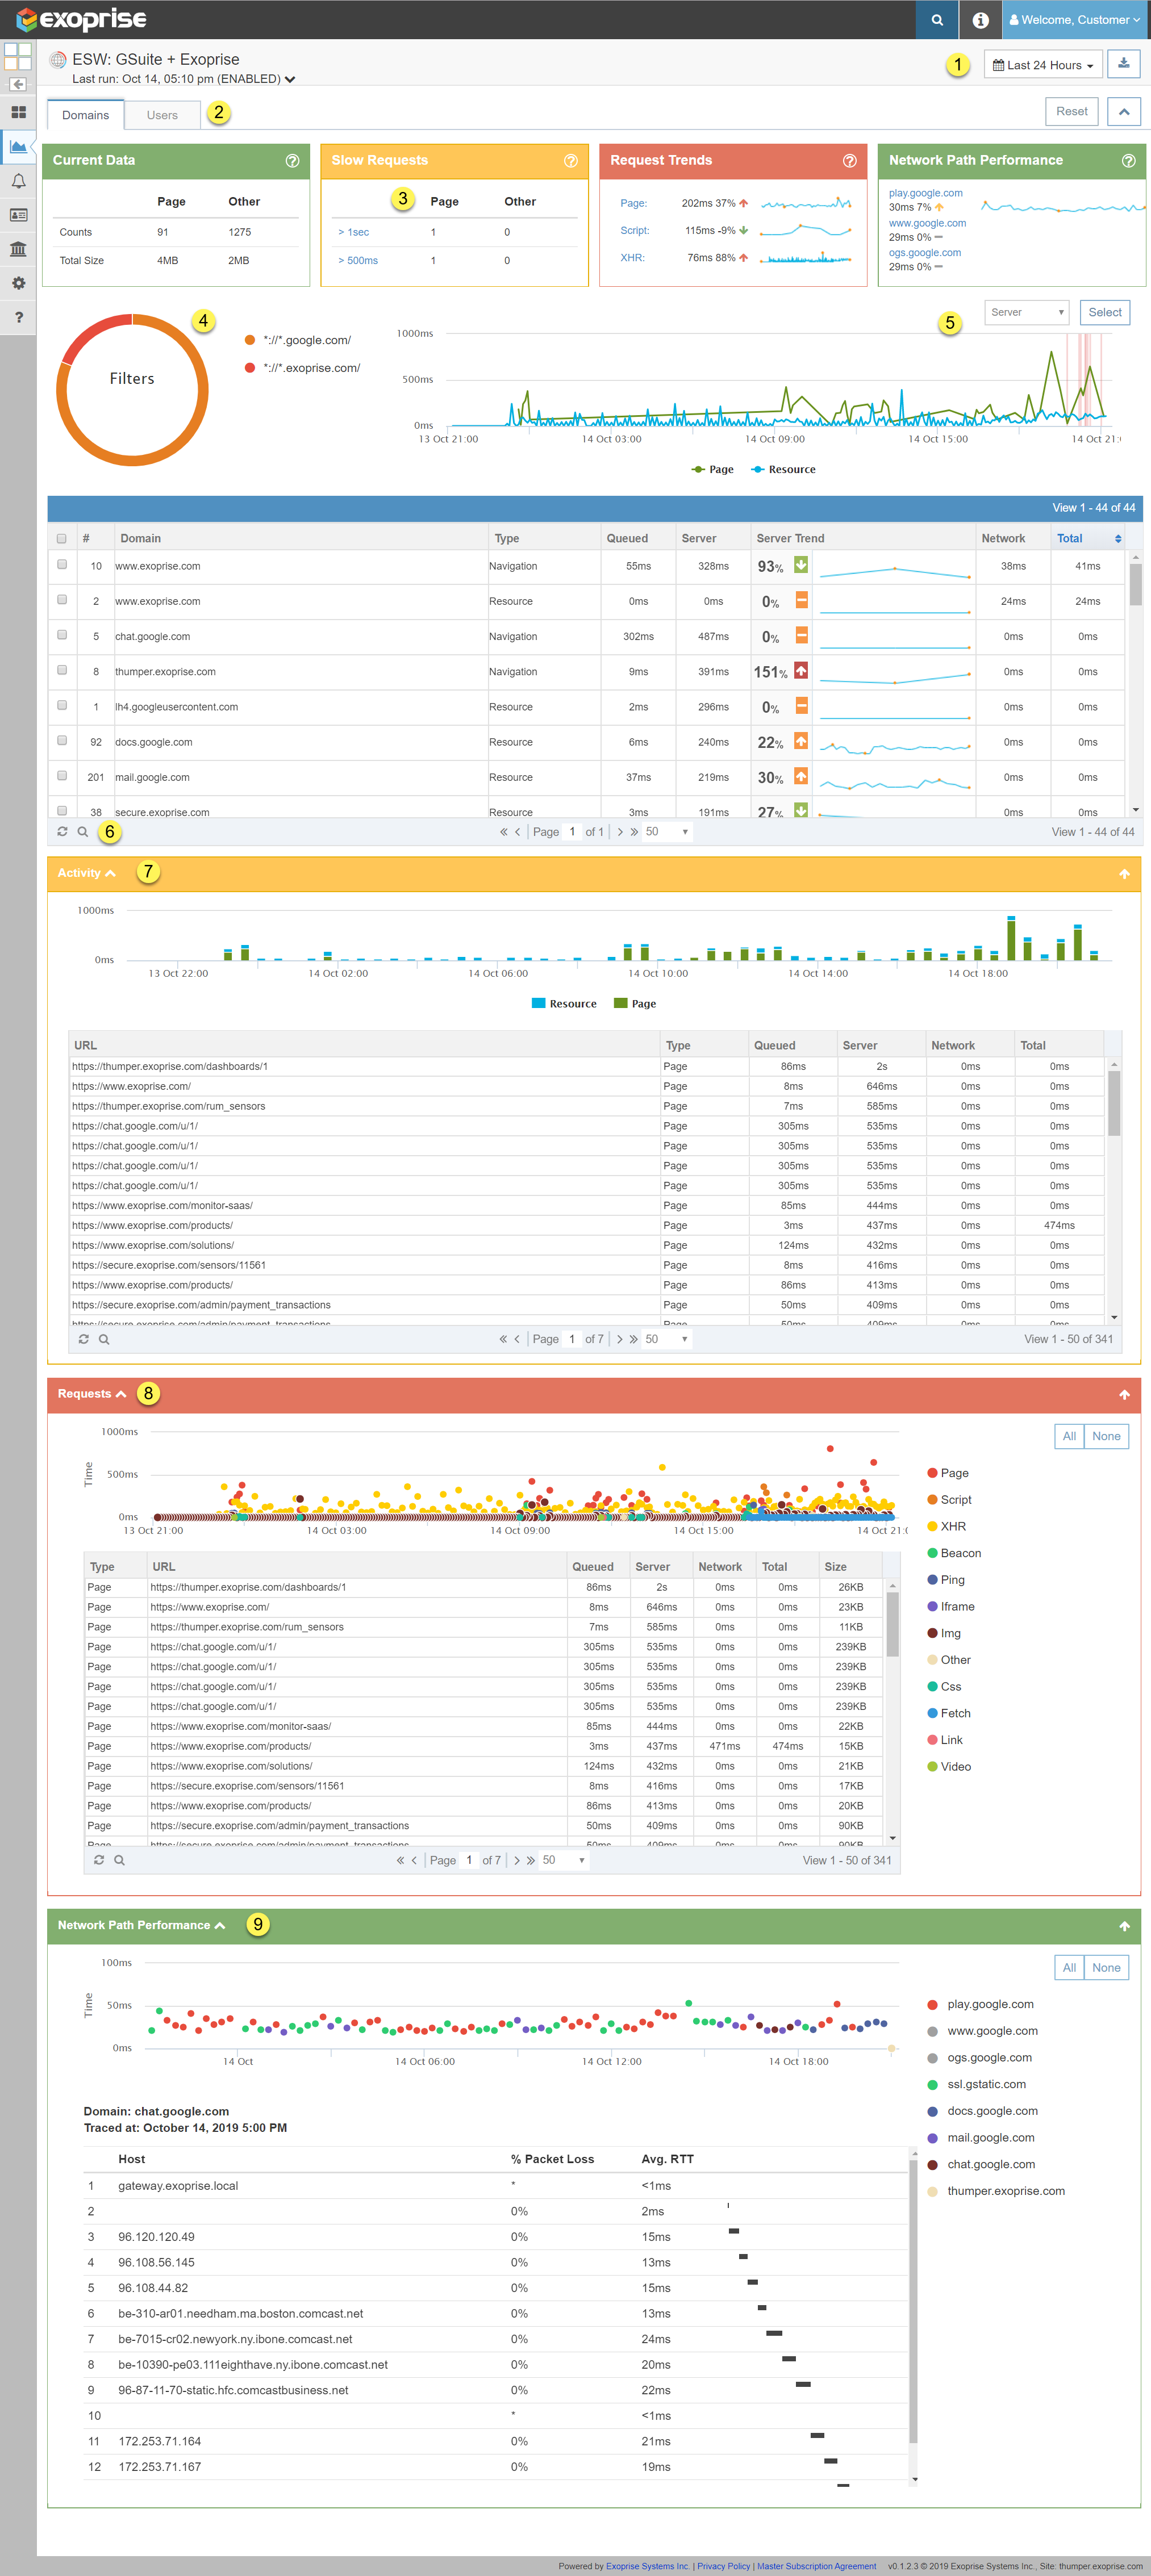
Sample Service Watch Page Click to see a full image
How to Use the Service Watch Page
The Service Watch analysis pages (its actually a Single-Page App) have been improved for analysis and drill-down capability to find and fix performance problems fast. Filter by user, application, or domain to quickly resolve and correlate tickets with outages and performance degradation.
- Select how far back you want to look at data
- Filter by domains or users
If a particular user is reporting a problem then analyze per user. If multiple users are reporting problems with a specific app, then search by domain. - High-level scorecards
From left to right:- Requests and sizes provide a qualification of the data collected
- Slow requests within time period show how many requests are slow, hover on the question mark to see the criteria.
- Trends of the slowest resources types across all requests
- Hop-by-hop Network Path Performance that details where in the network the browser is being slowed.
You can click on any of the scorecard headers to navigate to the different areas within the page.
- Pie chart of the number of requests that match the URL/Domain filters. Click a segment to filter the graphs and charts.
- Overall graph of navigation and XHR requests
- Grid of domains or users can be filtered by clicking the question mark in the lower status bar. Sort this grid by Time-to-first-Byte, Wait time, and Download time for each request.
- Activity chart shows a timeline of the requests grouped by URL across all of the Service Watch deployments.
- The Requests grid shows the collected requests, aggregated by URL and type of request. Hover over the legend to the right of the grid to highlight the types, sort by any of the values to identify which requests are slowing your users down.
- Network Path Performance chart and hop-by-hop data shows the various traces that Service Watch performs on behalf of users to the most requested domains within the time period. Hover over the legend to the right to highlight the traces by domain.
How's It Work?
Read this previous blog post for the full rundown of how to get started installing and deploying Service Watch for your organization. There are other methods, too, because our Service Watch extension is part of the Chrome Web store.
You can automatically force or deploy the Service Watch extension leveraging the Chrome policy and include it alongside Chrome Devices. Here’s more information about using Chrome policy to install the extension:
New Integration for Network Path Performance
Exoprise recently added support for Private Site integration alongside Service Watch extension installs. You can now configure secure domain filters and Service Watch instances to point to CloudReady Private Sites which be responsible for periodically gathering network statistics. This enables out-of-band tests for hop-by-hop Network Path Performance alongside your Service Watch browser extensions.
By combining network path data and local LAN performance alongside page load and background XHR requests, administrators get a complete picture of the end user experience for browser applications.

Related Posts


