With every webpage loaded, email sent, or video streamed, network traffic takes a complex journey…
Browser Real User Monitoring for SaaS
You surf the internet, don’t you?
While all are at home due to Covid, the vast majority of work is happening online. IT managers are looking for tools that can monitor browser response time for real users so they can optimize the experience. Also, executives are reading reports about the best monitoring solution in the market. Not only that, Project managers are using Microsoft Teams for collaboration. And everyone is using OWA to check their mails.
No matter what, everyone is using browsers for connecting online and accomplishing tasks. Therefore, optimizing the digital experience for SaaS and browser-based applications is becoming important more than ever.

Remote Work Requires Digital Experience Monitoring (DEM)
According to Forrester, remote work will rise to 300% of pre-Covid 19 levels.
As a result, existing IT systems won’t be able to support a vast workforce. Business leaders are under pressure to monitor employee productivity for meeting business goals. Thus, technology teams will need to invest in modern tools. Their priority will become monitoring employee experience, applications, and services.
But here is the truth…
One way to meet this upcoming challenge is to deploy Real-User Monitoring (RUM) for SaaS apps that we don’t own.
SaaS monitoring becomes mission-critical when end-users depend on tools such as Office 365.
What Browsers Can You Use for Monitoring SaaS Application Performance
Service Watch Browser helps businesses monitor critical SaaS applications and services from the end-users perspective. But only for the domains and websites that matter to IT. This ensures worker privacy while still providing a superior digital experience. Service Watch Browser extension is available with configurable filters to monitor websites.
Why is that important?
When users visit configured apps in their browser, Service Watch Browser retrieves performance metrics.
As of today, we support the following list of browsers:
- Google Chrome
- Microsoft Edge
- Mozilla Firefox (coming soon)
How Real User Monitoring Solution for SaaS Benefits IT
End-users benefit from SaaS Browser-based real user monitoring in several ways.
Reduce Troubleshooting Time
– The browser extension captures and analyzes remote session data. Know whether SaaS apps are slow for a particular user or the entire network. Service Watch Browser is the Go-To-Market troubleshooting solution for reducing MTTR.
Improve Application Performance
– RUM can’t predict or notify when a user will be affected. CloudReady synthetics with Service Watch provides a complete picture by correlating different perspectives.
Enhance End-User Digital Experience
– Collect diagnostic information such as latency, availability, response time, etc. Network admins can make decisions quickly to deliver a great experience. Remote teams are sometimes unsure of where the fault lies in the entire network.
Browser Monitoring for Real End Users
Running Service Watch agents on remote worker machines is a good starting point. But first, decide what your goals are behind collecting this data. As users work from home, Service Watch Browser insights generate rewards for your monitoring strategy.
- Mobile and Remote Users – These users should be the first to use browser extensions in their browsers. That way IT can measure the end-user performance of integrated cloud applications.
- Branch Office Users – Here, people work in different departments, and access apps such as Office 365. They could be business leaders, IT managers, analysts, etc.
- Network Administrators – IT admins can also be acceptable pilot candidates. As early adopters, admins can install Service Watch Browser synthetics and then deploy it for everyone.
- Users Complaining of Slow Performance – For those who face application slowness, the extension immediately shows the bottleneck.
Configuring Browser Synthetics to Detect SaaS Performance Issues
Below are the steps required to install the Browser extension.
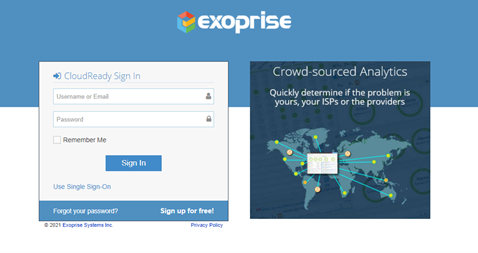
- First, sign up for a Free 15-day Trial with Exoprise
- Then, start by adding a Service Watch configuration in the “Real User Monitoring” area:
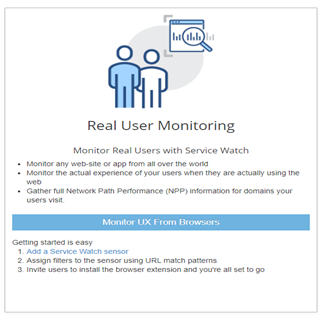
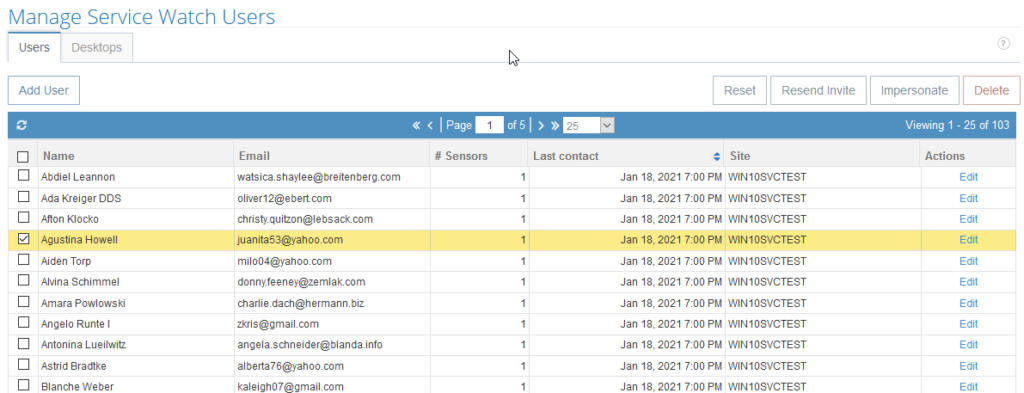
- Invite users to install the Service Watch Browser extension from the Chrome Web Store or Microsoft Edge Web store. Select trial user candidates who may be working in different locations. Or those who may be experiencing SaaS or MS365 performance problems.
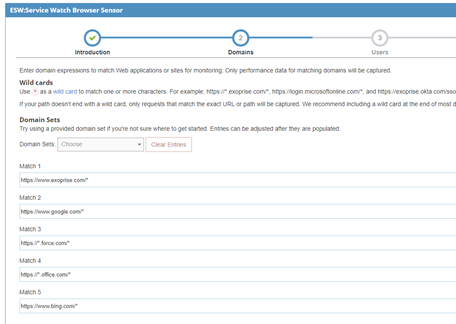
- Configure Service Watch for SaaS Applications to only monitor those domains. Use the pre-configured domains for GSuite, Microsoft 365, and Salesforce.
- That’s it, you’re done!
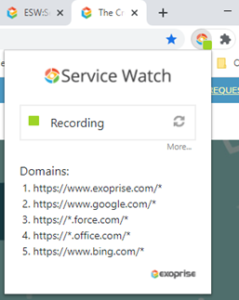
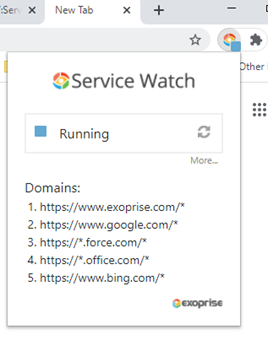
Notice the extension installed in your Chrome browser (or new Microsoft Edge). The Service Watch Browser extension indicator shows green color when visiting configured domains. Otherwise, the blue color indicates that the extension isn’t examining the domain performance.
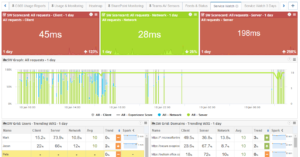
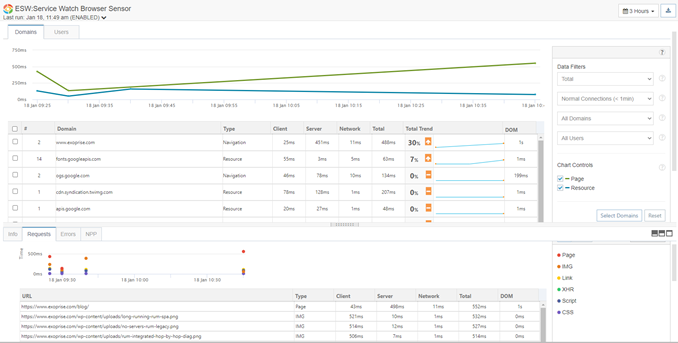
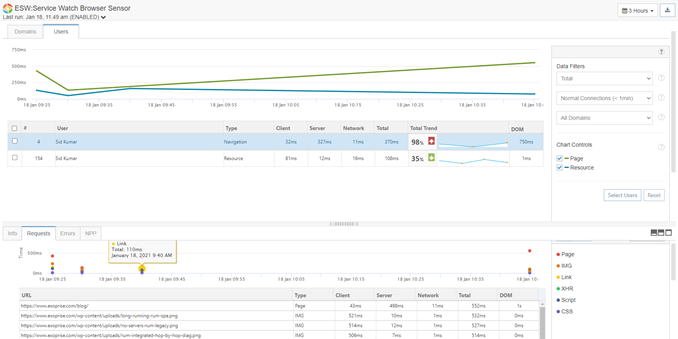
Browser Monitoring Dashboards to Support Work From Anywhere
With the Service Watch Browser Dashboard, IT visualizes browser activity for individual domains in real-time.
But guess what?
You can understand where the issue lies by quickly comparing it with the crowd data. Select one of the filters (client, server, network). Drill down to analyze slowness or other persistent affecting employees. Trends highlight slow connectivity and network problems affecting multiple users. Optimize digital experiences with newly discovered insights with browser real user monitoring.
Start Browser RUM for Cloud and SaaS Applications
Exoprise continues to innovate in the field of Digital Experience Monitoring. Service Watch Browser real user monitoring is an example. Monitor enterprise SaaS application performance such as Microsoft 365, Teams, Salesforce, Workday, etc. in any environment – cloud, on-prem, or hybrid. See all dependencies a business-critical SaaS service relies on and how its performance impacts remote worker experience.
Deploy the browser plugin agent with Service Watch Desktop to get a complete experience picture for SaaS apps through our browser monitoring software.
Request a demo from our team today and unlock insights for your remote team.
Related Posts


