With every webpage loaded, email sent, or video streamed, network traffic takes a complex journey…
Introduction
User experience is subjective.
For example, asking tourists visiting New York City about their experiences gives different answers. Likewise, end-users who work remotely with different resources and disparate assets can have varied experiences with their business apps. How can IT teams gather this experience data and react faster to improve the experience? The answer is a Digital Experience Score.
Scoring and indexing digital experience reduce ambiguity by collecting low-level metrics from endpoint devices and browsers. Not only that, it generates a high-level numerical index to identify optimization opportunities. The result is a normalized baseline score across the organization regardless of the asset or work location. IT gets more than just basic visibility with valuable benchmark information to quickly troubleshoot workplace application issues.
There we go. Optimized Workplace!
Keep reading…
The Digital Experience Score from Exoprise
 Exoprise Service Watch calculates many different scores as part of its real user monitoring strategy. Two aggregate scores to measure employee experience include
- Web Experience Score (WXS)
- Desktop Experience Score (DXS)
Launched in September 2020, both scores help IT prioritize service to end-users in a distributed environment.
How? By,
- Tracking transactions in the real world and
- Monitoring network traffic.
You might think to yourself.
So, what’s next?
In 2021, Service Watch expands and advances its scoring capability. The product will capture thousands of low-level metrics across endpoint resources, multiple SaaS sites, end-user locations, and thick-client apps. And the synthesis of these data points makes up the composite WXS and DXS.
1. The Digital Experience Score for the Web (WXS)
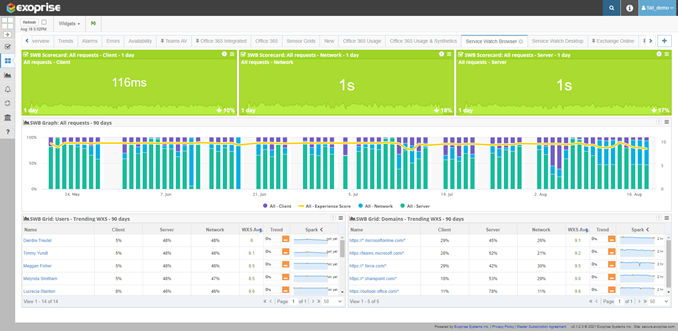
WXS measures the health and performance of web apps from an end-user point of view, regardless of device, network, or browser.
It should be noted that the score calculates the total network, client, and server segment performance of a web or SaaS application. While WXS Scores range from 1-10, a higher score of 8-10 is the first choice for support teams.
You are already struggling to manage a distributed workforce with varying network connectivity. With WXS, immediately focus on users with lower scores – indicating poor performance.
How to do this?
- Create custom URLs in the Service Watch Browser extension
- Browser plugin collects web session data
- Data aggregates in Exoprise servers to generate WXS
- Monitor the web experience of all users from any location
It’s that simple!
Baseline App Performance with Browser Real User Monitoring (RUM)
Following web performance, issues are usually common. Isn’t it?
- Slow server
- Traffic congestion
- Low bandwidth
- Network connectivity issue
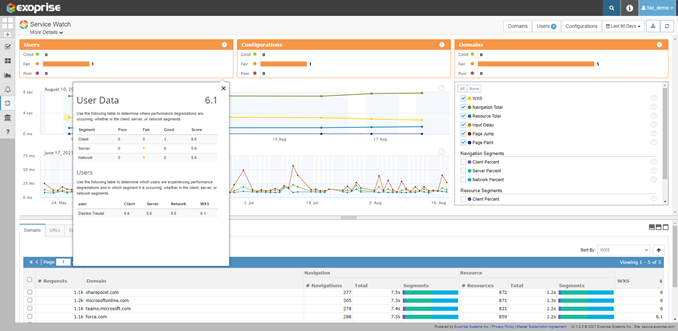
Tackling such issues is critical. Therefore, you want to ensure that employees can access mission-critical apps and stay productive. So, after generating the WXS, filter users with lower experience scores. As shown below for a specific user, the detail page shows a consistent low WXS of about 6.
Drill into the following segments. And find what is causing the bottleneck.
- Client segment
- Server segment
- Network segment
- Transactions and response times
For example, filter by domain to see which SaaS properties are slower than others. By analyzing these critical data points, you will be able to understand and prepare to improve EX.
Furthermore, correlate hop-by-hop network path data. This reveals whether the problem is with the corporate LAN, gateway, or proxy.
For home users, it might be the home network, ISP, or WI-Fi that is the source of the bottleneck.
The Web Experience Score Metrics to Troubleshoot SaaS Performance Issues
ok, so what constitutes the WXS?
The Browser WXS uses multiple user-centered metrics in the background to measure SaaS and web application performance.
With these data points, IT executives have a deeper insight into the employee experience. Some of the metrics are:
- AJAX/XHR Requests
- Largest Contentful Paint (LCP)
- First Input Delay (FID)
- Cumulative Layout Shift (CLS)
- Page Errors
- Request Timings etc.
For more information on key metrics, please visit our previous blog.
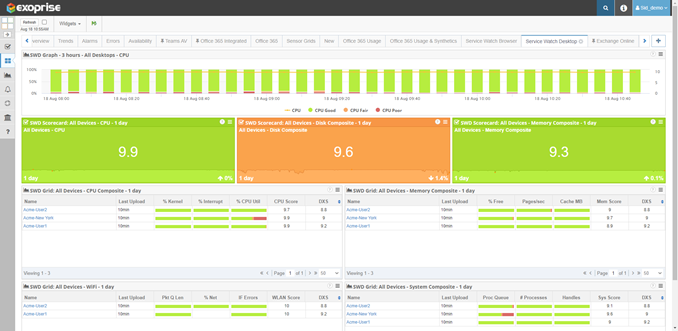
2. The Digital Experience Score for the Desktop (DXS)
On the other hand, the Exoprise DXS is an all-encompassing score that quantifies the overall experience of end-users accessing apps from their desktop or endpoint devices.
The resulting score, between 1 and 10, comprises composite metrics such as
- CPU
- System
- Disk
- Memory
- Ethernet
- Wi-Fi signals
Additionally, the DXS captures crashes, hangs, freeze for thick-client applications such as Teams, Outlook, Zoom, etc. alongside the Windows® reliability index.
Undoubtedly, Exoprise collects thousands of metrics to calculate the DXS and represent an accurate experience picture, unlike other monitoring solutions.
A high score (8-10) for the DXS indicates the optimal experience of an employee working with Desktop applications such as the Microsoft 365 Office suite.
Improve Application and Network Issues with Endpoint Monitoring
ok, so what does a lower DXS say?
It indicates lower productivity and the need to examine endpoint experience issues. Thus, you must examine all-composite metrics for users who continue to have a low DXS.
Also, compare these metrics with the crowd to see if the problems are with everyone. Further, if you try to dig into diagnosing individual machine or endpoint, issues could be:
- Slower CPU
- Insufficient memory
- Low disk capacity, etc.
Exoprise Service Watch Desktop provides end-to-end visibility into Microsoft 365 Desktop apps such as Outlook, OneDrive, and SharePoint.
The Desktop Digital Experience Score Metrics – Part 1
Now, let’s look at all the metrics that compute when users are active on their devices.
Exoprise receives the underlying data from endpoint machines every 30 seconds. During this time, a machine is being used and generates the corresponding composite score.
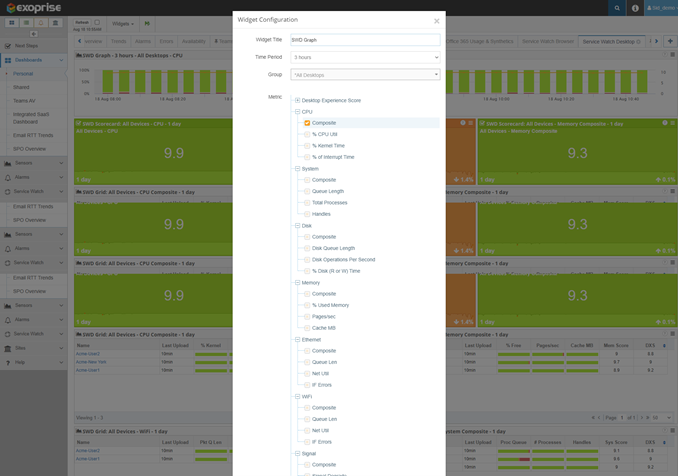
- CPU
- Sub metrics %
- CPU Utilization
- Kernel Time
- Interrupt Time
- A low CPU score indicates the need to upgrade the processor to a faster and newer one.
- Reducing the workload can improve the performance and benefit the end-user.
- Sub metrics %
- System
- Sub metrics
- % Queue Length
- % Total Processes
- Handles
- When a machine is at a high capacity, it can result in a lower system score.
- In combination with a low CPU and memory score, the device is ready for an upgrade.
- Sub metrics
- Disk
- Sub metrics
- Disk Queue Length
- Disk Operations Per Second
- % Disk (R or W) Time
- Expect to upgrade hard drives when the performance deteriorates over time.
- Sub metrics
The Desktop Digital Experience Score Metrics – Part 2
Another set of digital experience scores for diagnosing desktop issues include:
- Memory
- Sub metrics
- % Used Memory
- Pages/sec
- Cache MB
- A low Memory composite score indicates high system memory usage.
- Possible reasons could be app memory leaks or excessive usage.
- Seeing a persistent low score would call for a machine upgrade.
- Sub metrics
- Ethernet
- Sub metrics
- Queue Length
- Net Utilization
- Interface Errors
- If the Ethernet composite score is low, IT teams should investigate the following
- Excessive LAN network workload
- Congestion
- Connection problems
- Errors
- Sub metrics
- Wi-Fi
- Sub metrics
- Queue Length
- Net Utilization
- Interface Errors
- Consistently low Wi-Fi Score means that end-users are experiencing jitter during conference calls.
- Consider connecting to a better Wi-Fi source.
- Expand the number of Wi-Fi access points.
- Sub metrics
- Signal
- Sub metrics
- Signal Degrade
- Link Quality
- Like the Wi-Fi composite score, a low Signal composite score indicates poor Wi-Fi signal strength or quality.
- Streaming videos continue to loop in the buffer.
- End-users can increase their speed with the ISP and add additional access points.
- Sub metrics
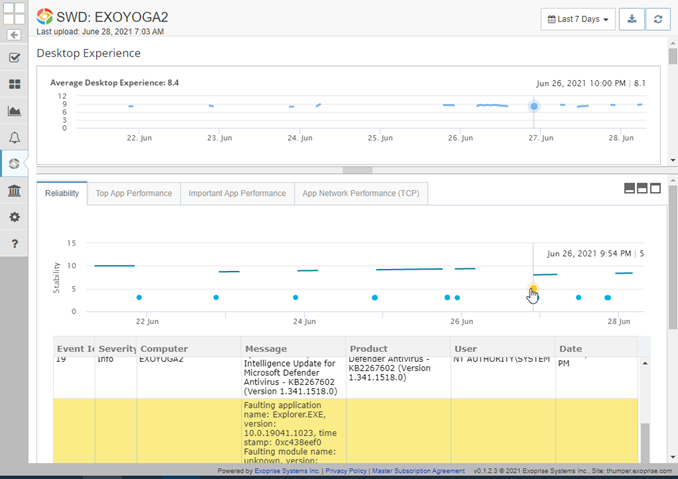
Diagnosing Endpoint Stability with the Reliability Score
Want to ensure stability for remote worker machines?
Service Watch Desktop collects and aggregates key application and system events in real-time.
Consequently, Windows Events form the reliability index builds into the DXS. The index is a Microsoft measure of the stability of the machine.
Using the reliability index, you can monitor the stability of an endpoint device anywhere in the world. For example, any dip in the stability score usually means an incorrect app install or update.
Measure and Optimize the Digital Experience Score with Our Monitoring Tool
Last but not the least, take advantage of the Exoprise free trial offer. Make digital experience scores part of your monitoring strategy.
To sum up, use Service Watch digital experience monitoring tool on the following licenses for real user monitoring.
- 25 Service Watch Desktop
- 50 Service Watch Browser
Optimize visibility, identify bottlenecks, reduce MTTR, and improve workplace engagement across the organization. Additionally, deploy CloudReady synthetic sensors for mission-critical apps to get full coverage of Digital Experience Monitoring.
- Microsoft 365
- Office 365
- Teams
- Zoom
- Salesforce
- Workday
Related Posts


